We live in a global society: products are made and food is grown in one part of the world and shipped to another part of the world to the consumer. A cargo plane, a semi-truck or a ship loaded with thousands of containers might transport the product the furthest distance, but that is not usually the vehicle that delivers it to the consumer. There’s still what’s called the “last mile,” which entails moving products from the regional warehouse to a retail store or delivering it directly to a consumer’s business or home, and “last steps,” which is the actual delivery of product to the front door or mailbox.
Companies aim to deliver product in the fastest way possible, which makes the “last mile” and “last steps” key parts of the transportation chain. Many companies choose to create their own enterprise basemaps because it allows them to add the additional information and vectors that matters to their employees. A logistics planning team that leverages remote sensing and derived geospatial data can make a significant impact on a company’s bottom line by moving product around the world in the most efficient way possible.

There are a few remote sensing and derived geospatial data products that are particularly helpful for logistics planning:
Vivid, Metro and Dynamic Basemaps
A logistics team needs to start with a clear, visually consistent and highly accurate basemap. This allows them to create their initial map from a reliable and trustworthy source using either manual mapping methods or machine learning algorithms. Maxar offers basemaps that suit different needs:
- Vivid is a 50 cm, high-quality, global basemap that enables mapping at the local, regional and country level.
- Metro includes 6,000 metropolitan areas that are refreshed on an annual basis, including 3,000 cities at 30 cm resolution, enabling precision mapping in populated areas.
- Dynamic offers flexibility in creating the imagery basemap over specific areas of interest, where parameters can be defined around image currency, spectral bands and resolution.
In addition to providing the foundation for an enterprise map, these satellite imagery mosaics provide the right input for machine learning algorithms to extract vector data layers like roads, paint lines, lane boundaries, turn restrictions, traffic flow, road furniture, traffic lights and signposts. This additional information can help determine the most efficient routes for last mile deliveries. They are also useful in developing maps for autonomous vehicles to use for navigation. Maxar is working with Toyota Research Institute-Advanced Development, Inc. (TRI-AD) and NTT DATA to create these HD maps in an automated fashion and announced the successful results at the beginning of March 2020.

Persistent Change Monitoring (PCM)
Once a logistics team has created an enterprise map, they will need to keep it updated to reflect recent changes due to construction, traffic changes and road closures, among other reasons. Maxar's PCM, a patented algorithm that draws immediate attention to areas with new activity, allows the end user to focus only on the areas that have updates, instead of manually scanning fresh imagery to find areas that have changed. In this blog post, PCM was used to analyze the development of Houston, Texas over the last 30 years, during which the road map of the area changed significantly.

SecureWatch
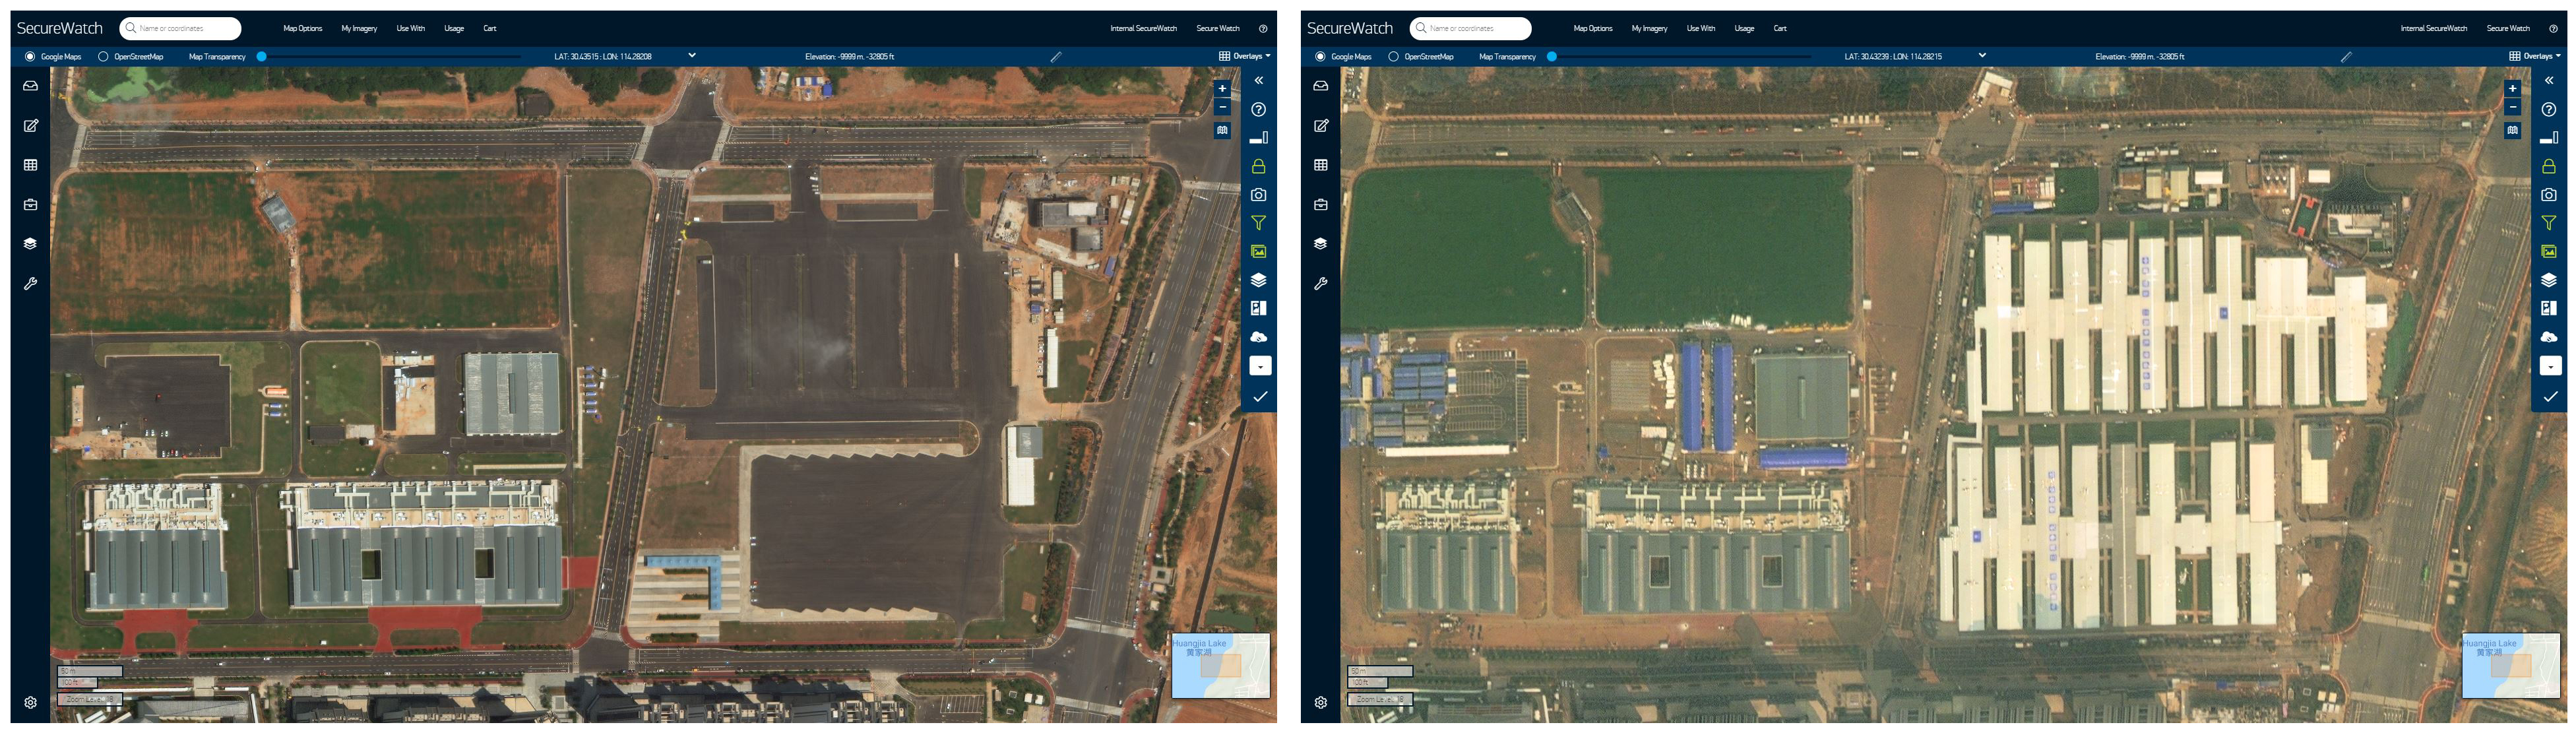
So the logistics team created an enterprise map and identified areas that may need updates to the road data. Maxar's SecureWatch, a cloud-based geospatial platform, provides streaming and downloading access to Maxar’s archive and daily satellite imagery collections. A quick check on SecureWatch of the latest imagery, which is the highest resolution commercially available, will tell the logistics team if the update identified in PCM will impact their deliveries or not. If it is related, they can quickly edit their enterprise maps to keep their last mile deliveries on track without detours. If the update is not related, they can move on to the next update without wasting a lot of time. To learn how SecureWatch can help organizations explore, analyze and exploit geospatial intelligence, please read this blog post.
For thousands of organizations around the world, the work done by logistics teams saves lives, resources and time. These teams have the opportunity to improve their mapping processes and deliveries by leveraging off-the-shelf geospatial solutions from Maxar. Please contact us to understand how we can help optimize your efforts or to learn more about Maxar’s solutions for automotive, please visit our website.