Methane is emitted as a byproduct of many industrial processes, including oil and gas production, waste management and agriculture. It is a significant contributor to global warming. Methane gas has 20-80 times the atmospheric heat-trapping greenhouse impact of carbon dioxide, according to the U.S. Environmental Protection Agency. Reducing methane emissions can lower the effects of greenhouse gases on the global climate but doing so requires knowledge of methane sources. Maxar is using specialized imaging technology on its WorldView-3 satellite to identify and quantify methane emissions around the globe and to enable responsible parties to take corrective action.
Maxar’s WorldView-3 satellite hosts the only commercial high-resolution, 8-band shortwave infrared (SWIR) sensor on orbit. While Maxar’s SWIR imagery is most often used to look through smoke to pinpoint where a wildfire is burning or to help identify types of material on the ground, the sensor can also detect methane emissions using spectral bands invisible to the human eye.
Maxar recently developed an algorithm to process SWIR imagery to map methane plumes at 3.7-meter spatial resolution, which is higher than any current or planned space-based system. This algorithm enables the end user to precisely locate emission sources within 5 meters CE90 of the methane emission location. Currently, our team is refining the algorithm and characterizing its accuracy under a wide range of environments and associated clutter noise from man-made materials, soil and other features such as asphalt or dirt roads.

Maxar’s WorldView-3 satellite as seen in an artist’s rendering.
The first step is figuring out where to task WorldView-3 to look. We use third-party data from sources such as NASA’s upcoming TEMPO sensor or ESA’s Sentinel satellites, which detect methane emissions over broad areas at low resolution. We can then cue WorldView-3 to take a closer look at the area in high resolution and the algorithm performs point-source methane emission quantification at the source location.
This approach is of use for commercial organizations accrediting the environmental compliance posture of a company for environmental, social and governance (ESG) reporting purposes and regulatory agencies seeking independent visibility into corporate methane emissions performance. This technique can also leverage customer inputs to examine areas they suspect might be emitting methane. For example, an oil company that seeks a systematic and consistent set of methane emission detections can provide its well site locations to Maxar, and we will image the sites using WorldView-3 and provide detections and emission rates back to the oil company. Maxar will also provide high-resolution imagery collected at the same time to provide additional context that validates the assignment of methane measurements to the well sites.
Maxar’s methane mapping algorithm can automatically identify and quantify methane emissions of greater than 1,000 kg per hour with a wind speed of 10 miles per hour. Maxar’s research and development scientists note the visual inspection of the methane mapping layer can identify methane plumes down to much smaller emission rates of less than 50 kg per hour with 10 miles per hour wind speed. The actual minimum detectable quantity is influenced by several factors, including:
- Mass flow rate (rate of methane emissions in kg per hour)
- Flow velocity (wind speed for leaks, forced flow for mine vents)
- Point source (e.g., pipeline leak) versus distributed source (e.g., landfill)
- Spectral clutter of the imagery
- Atmospheric stability (turbulence)
Maxar’s methane quantification algorithm accounts for these factors.
Maxar’s approach allows for scanning large areas for methane emissions with high positional accuracy (WorldView-3 can scan several thousand square kilometers in a single pass) as compared with other systems that sacrifice high resolution and positional accuracy to perform broad area surveillance, though these latter systems can be used to cue a WorldView-3 collection. Maxar’s larger collection footprint combined with the methane mapping algorithm helps customers identify leaks effectively over large operational areas such as oil basins and cities. Further, our automated algorithm allows Maxar to deliver methane leak maps within hours of data acquisition, enabling customers to quickly mobilize teams in the field to take corrective action to mitigate leaks.
Two sample results from Maxar’s methane mapping algorithm are shown below. The galleries contain the methane mapping identification image, generated using the eight WorldView-3 SWIR bands, paired with a standard image of the area.
Permian Basin

This SWIR image is a false-color representation of the scene using WorldView-3 SWIR bands 6, 7 and 8 to correlate physical features to the methane plume location. By using only three SWIR bands, the methane plume is illuminated in an orange color that stands out from the rest of the image.

This image is produced by applying Maxar’s methane mapping algorithm to all eight WorldView-3 SWIR bands to produce a methane concentration image, which helps pinpoint the location of the leak and emitting methane at a rate of 4322-8030 kg per hour.
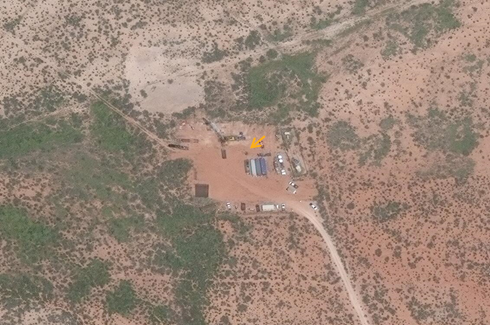
This Maxar WorldView-3 satellite image is zoomed in further to provide more detail about the location of the methane plume displayed in the methane mapping image. The yellow arrow points to what we believe is the methane source: an unlit flare emitting gas.
This example shows an area in the Permian Basin, a major oil and gas production zone in the southwest United States. The image, collected September 11, 2021, has been produced using three different sets of SWIR bands to understand different types of information.
Goturdepe Oil Field, Turkmenistan
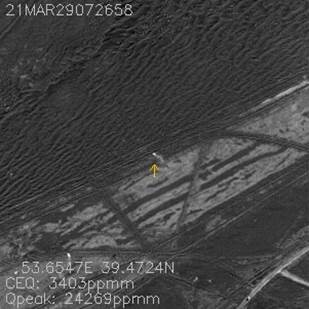
Maxar’s methane mapping algorithm reveals a low-flow methane plume (118-222 kg per hour) by using all eight WorldView-3 SWIR bands. The yellow arrow points to what the Maxar team believes is likely a pipeline or well head leak.

This standard Maxar WorldView-3 satellite image provides context for the location of the methane plume displayed in the methane mapping algorithm image.
This example reveals low mass flow rate methane plumes in an area of the Middle East that produced approximately 1.3 million tons of crude oil in 2020, according to Business Turkmenistan. This image was collected March 29, 2021, and produced in two different ways.
Customers interested in identifying and quantifying methane emissions quickly, with high resolution and on a global scale can benefit from Maxar’s methane mapping technology. These customers include federal, state and local agencies; nongovernmental organizations; and global industries such as oil and gas, mining and waste management. Maxar is investing today to productize its methane mapping capability for scalable production and will share more about this exciting capability in coming months. Customers with specific interest in detecting methane emissions who would be interested in participating in a product pilot
are invited to contact Maxar directly.
Other resources
Two external organizations have used Maxar’s WorldView-3 SWIR sensor to detect methane emissions:
- The European Space Agency used WorldView-3 data to detect and quantify methane plumes from an oil and gas production platform in one of Mexico’s major oil producing fields. Their report is available online.
- Belgian Earth Observation examined methane plumes with WorldView-3 imagery in Algeria, Turkmenistan and China. Their report is also published online.