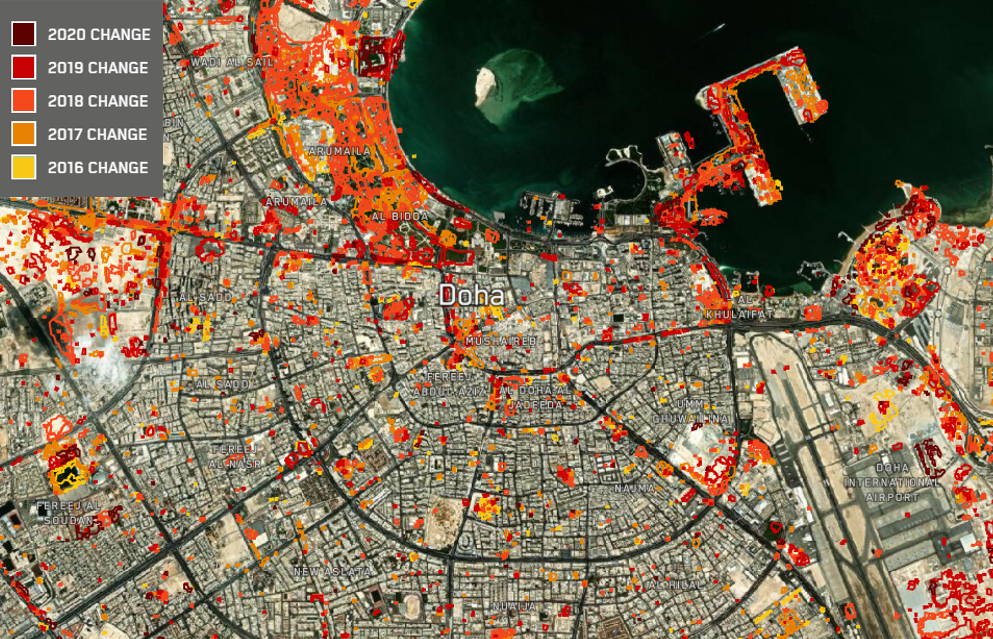
Now that the Summer Games in Tokyo are complete, soccer fans—or football fans, if you prefer—around the world are watching with anticipation as Qatar prepares to host the FIFA World Cup in 2022. The global sporting event features teams from 32 countries every four years. Maxar has been tracking Qatar's construction boom with Persistent Change Monitoring (PCM) and high-resolution satellite imagery. Between 2016 and 2020, PCM detected almost 54,000 hectares of land that underwent a measurable confirmed change. These changes involve the construction of more than 100 hotels and apartment buildings, stadiums, facilities, roads, ports and other significant infrastructure development. To put this amount of change into context, it’s the equivalent of 38,520 soccer fields changing significantly over five years.

Doha is Qatar’s capital and the nation’s most populous city. Use the legend on the left to see where PCM identified major changes that occurred between 2016 and 2020.
These preparations are happening on top of an existing nationwide surge in development. Rapid accumulation of wealth generated by oil and gas has fueled a massive influx of foreign workers and rising birthrates in Qatar. To accommodate its quickly growing population, the city of Doha has undergone the most infrastructure development in the nation. Perhaps the most notable of these developments is the recent construction of Hamad Port, seen below, which became fully operational in late 2016. According to Construction Weekly, the new port’s “size and facilities [offer] a quicker and easier method to import raw materials to Qatar, vital to the completion of the country’s many ongoing infrastructure projects.”

PCM tracked the progress of construction at Hamad Port, which is colorcoded by year in the legend on the left.
Maxar’s PCM algorithms highlight locations of persistent change—changes that remain steady after multiple satellite observations. This eliminates the need to manually scan imagery and allows users to understand and anticipate relevant changes at scale by filtering out noise from seasonal change and prioritizing important areas. PCM also enables users to see change over the past three decades using archived data. Detected changes are delivered as an image-based data layer with color-coded highlights that identify the months and years that changes took place.
Once a significant change is identified, users can leverage Maxar’s current high-resolution imagery to evaluate the area. Native 30 cm class resolution and derived 15 cm high-definition (HD) imagery deliver clear images that empower better decision-making through improved situational awareness. Now that PCM is available in SecureWatch, comparing change data and HD imagery side-by-side is easier than ever.

This GIF shows Al Bayt Stadium in Maxar’s high-resolution satellite imagery between 2013 and 2020.
We are eager to see the World Cup's kickoff at Al Bayt Stadium in November 2022. Until then, we'll be keeping an eye on the qualifiers—and watching Qatar's infrastructure changes with PCM.
Kick off your PCM
Pass the manual labor off to PCM and get right to the goal of analysis!
Tackle change