Blog

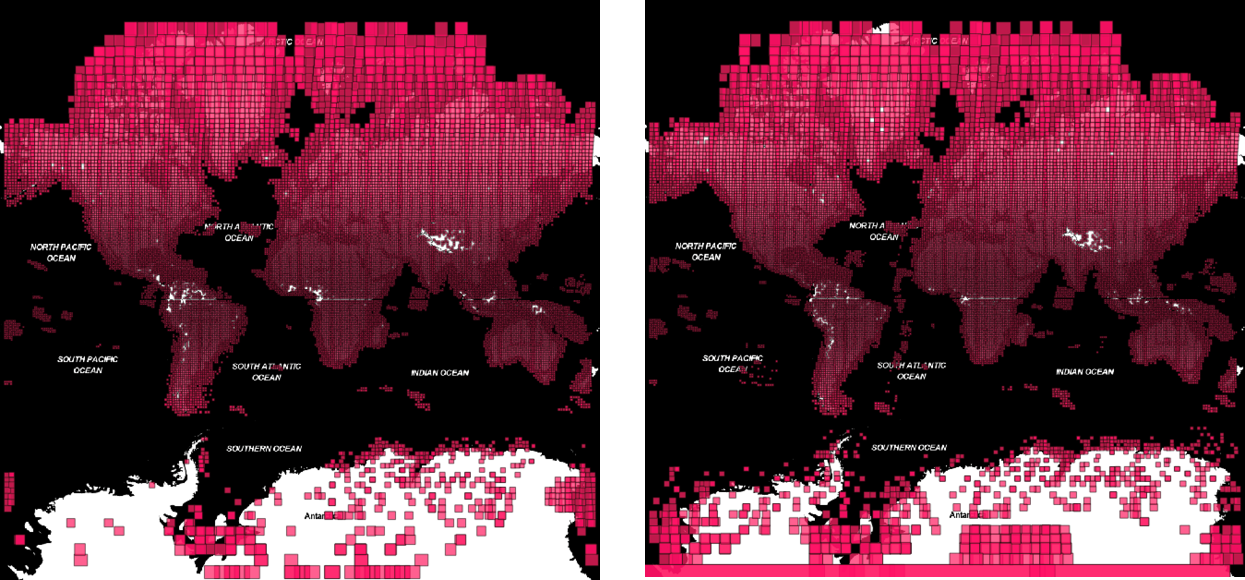
Water is essential for life on Earth, as we all know. And when a shortage occurs, as is happening now in Cape Town, South Africa, it’s a crisis. But mapping water across the planet to track changes and potentially prevent water shortages is challenging. For one, because water levels are dynamic and always changing, data collected one day can become obsolete fast; and two, piecing together imagery from areas around the globe from all available sources to get the big view of water locations has been a time-consuming process, which meant available maps were often outdated. Until now. The GBDX team at DigitalGlobe developed a workflow that enables us to automate the creation of worldwide water surface layer maps using open source, high-resolution 10 m Sentinel-2 satellite imagery available on AWS Amazon S3, run on the GBDX platform. This workflow processes an immense volume of data into a usable vector format, and also enables the aggregation of those layers to show relative change between years. How did we do it? First, we created a tile list. The European Space Agency (ESA) Copernicus program Sentinel-2 satellites collect several images at each location on Earth throughout the year. Launched on June 2015, Sentinel-2A collects one image per location every 10 days. In March 2017, Sentinel-2B was launched, boosting image collection at each location to every five days, which is why we find more images available in 2017 than 2016. Images are processed and accessed as a grid of slightly overlapping square tiles, where each tile is attributed with date and cloud cover. Inspecting each available image’s metadata for coverage area and collection date would be quite time- consuming. Luckily, this information has been precompiled within GBDX Vector Services. This service contains many vector sources, including the DigitalGlobe catalog, Landsat-8, and Sentinel-2 imagery footprints (with metadata) and OpenStreetMap vectors, among others. We used a GBDX Notebook running Python loaded with the GBDX tools library, to query Vector Services for all tile footprints meeting our criteria: Sentinel-2 imagery with less than 10 percent cloud cover for the years 2016 and 2017. Where there were multiple tiles at the same location meeting these criteria, preference was given to those images closest to June 1 in the Northern Hemisphere and December 1 in the Southern Hemisphere. The final tile selections were stored in a list for water extraction. In total, there were approximately 27,000 tiles selected for each year. You can find our tile selection notebook here. Note: You must be logged into GBDX Notebooks to actually view them or you will get an error message. [caption id="attachment_6253" align="aligncenter" width="645"]water extraction Left: 2016 tile selection. Right: 2017 tile selection.[/caption] Next, we extracted water vectors. The true power of GBDX is the ability to run workflows, composed of tasks, in parallel. We used a published AnswerFactory recipe (essentially a workflow) that given a Sentinel-2 tile ID, extracts water boundaries to a vector format. The water vector extraction workflow is (task name in brackets):
  • Convert raw Band 3 (green) and 11 (SWIR) images from JPEG 2000 to TIFF format, set NoData values to zero, convert from integer to float data type, resample Band 11 from 20 m to 10 m resolution. [gdal-cli-multiplex]
  • Apply Modified Normalized Difference Water Index (MNDWI), where the SWIR band has been resampled to 10 m from its original 20 m resolution, to match the 10 m resolution of the green band. [gdal-cli-multiplex]
MNDWI = (Green10m - SWIR10m) / (Green10m + SWIR10m) Again, within a GBDX Notebook, here we launched one workflow per tile ID in our lists. So, for those of you keeping score, we ran approximately 54,000 workflows, each containing 11 tasks, or about 594,000 tasks. Each workflow took about 30 minutes to complete, and in the end, we consumed around 24,000 hours of compute time. That’s just under three years (!) of processing time. Fortunately, GBDX scales to run the workflows in parallel, and this entire process was complete within 24 hours. Most of this time was taken up by the 54,000 workflows sent in series. If you wanted to be more adventurous, you could parallelize your workflow requests to speed up the process, but this leaves very little room for error if you discover a systematic problem after the requests have started. This example illustrates the daunting task of maintaining map layers up to date in response to seasonal changes or change occurring in remote areas. 2016 Vector Example 2017 Vector Example OSM & 2017 Vector Comparison 2016 Vector Example: 2016 water vectors overlaid on Sentinel-2 imagery (May 27, 2016). 2017 Vector Example: 2017 water vectors overlaid on Sentinel-2 imagery (July 31, 2017). OSM & 2017 Vector Comparison: 2017 water vectors overlaid on OpenStreetMaps basemap. All images are centered approximately at 58.85ºN, 81.2ºE. Last, we aggregated and compared vectors between years. Vector Services has a very convenient Aggregations API, which quickly queries and aggregates vectors into a more general format. We aggregated by geohash (level 3: about 1x1 degree) and summed the area of water polygon vectors to create maps for each year. We also subtracted the yearly results to produce a change map. You can see the results in a notebook here. 2016 Aggregation 2017 Aggregation 2016 & 2017 Change Aggregation These aggregation and change maps can help provide a generalized portrait of the immense global datasets that were created, and also help determine where to focus mapping efforts, identify areas of high levels of change, or pinpoint where to perform further analysis. Limitations
  • We used images collected on different dates and potentially different seasons to achieve cloud- free coverage. This implies that adjacent images may not match at boundaries, and overlapping images between years may not match.
  • MNDWI threshold may not extract waterbodies similarly in all images.
  • Thin features may be more susceptible to being filtered out by area.
  • Waterbody vectors must be dissolved (or otherwise processed) to use absolute number of waterbodies or total area of waterbodies. Contiguous waterbodies may be divided internally, inflating number of waterbodies. Also, due to the overlapping tiling scheme of Sentinel-2 imagery, the overlapping portions are likely to include duplicates of the same waterbody (possibly observed on different dates), inflating total number and area of waterbodies.
  • The footprint geometries for Sentinel-2 images returned from vector services reflect the tile geometry, but may not accurately describe the area containing usable data. We noticed images that contained null data across large areas, which would result in no mapped waterbodies in those regions.
  • The aggregated sum of areas also includes duplicate water bodies at geohash boundaries, inflating those absolute values.
Next steps As pointed out above, this product has its limitations. We welcome you to clone our published notebooks, make fixes as you see fit, and republish back to us. Of course, you could always build a product using our published notebooks as a starting point, and reap the profits yourself! Signup for access, try these out and please let us know what you think: https://notebooks.geobigdata.io/hub/sign_up
Prev Post Back to Blog Next Post