- Top-of-atmosphere (TOA) reflectance performs a normalization for solar energy. TOA normalizes the pixels values to the 0.0-1.0 range to reduce variability between images. Because the information needed to convert digital numbers (DN) to TOA reflectance values is known, this transformation is very fast and fully automated. The main limitations of TOA reflectance are the remaining effects of Rayleigh scattering (which results in bluish images), aerosol absorption and scattering phenomena (which result in non-uniform, decreased image visibility).
- Rayleigh-only reflectance accounts for the systematic properties of the atmosphere by removing the Rayleigh scattering component (a result of the interaction of sunlight with molecules in the atmosphere) from imagery. Again, the transformation is very fast and fully automated. In cases of very low aerosol loads, Rayleigh-only reflectance produces images that are less blue than TOA reflectance, but the effects of haze variability remain visible.
- Surface reflectance compensates for atmospheric absorption and scattering phenomena on a pixel-by-pixel basis. It approximates what would be measured by a sensor held just above the Earth surface, without any alterations from the atmosphere. Of these three choices, surface reflectance provides the very best visual experience—which is why it’s the method we use.
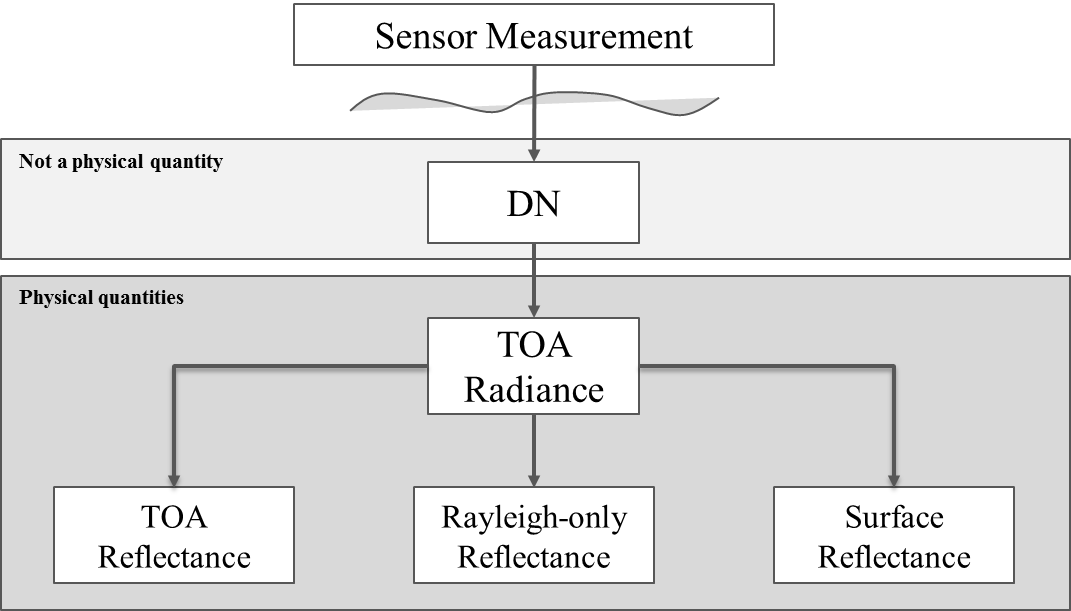 Figure 1: Schematic representation of nonphysical and physical quantities.[/caption]
The sunlight measured by satellites is proportional to the top of the atmosphere (TOA). In addition, sunlight reflected by the Earth’s surface will be impacted by the atmosphere. As a result, DN counts are unique to the sensor, atmospheric conditions at the time of capture, and the very specific operational setting selected for the acquisition. Because this has a very dramatic impact on machine-learning algorithms, it is always preferable to process raw images to remove atmospheric affects and allow for more accurate analysis.
Different Methods, Different Results
Here’s a sequence of images that really shows the difference between methods. Figures 2-5 illustrate the three reflectance products in a time-series over Hanoi, Vietnam. The images were acquired by WorldView-2 between 2010 and 2013 with different atmospheric conditions.
[caption id="attachment_6087" align="aligncenter" width="751"]
Figure 1: Schematic representation of nonphysical and physical quantities.[/caption]
The sunlight measured by satellites is proportional to the top of the atmosphere (TOA). In addition, sunlight reflected by the Earth’s surface will be impacted by the atmosphere. As a result, DN counts are unique to the sensor, atmospheric conditions at the time of capture, and the very specific operational setting selected for the acquisition. Because this has a very dramatic impact on machine-learning algorithms, it is always preferable to process raw images to remove atmospheric affects and allow for more accurate analysis.
Different Methods, Different Results
Here’s a sequence of images that really shows the difference between methods. Figures 2-5 illustrate the three reflectance products in a time-series over Hanoi, Vietnam. The images were acquired by WorldView-2 between 2010 and 2013 with different atmospheric conditions.
[caption id="attachment_6087" align="aligncenter" width="751"]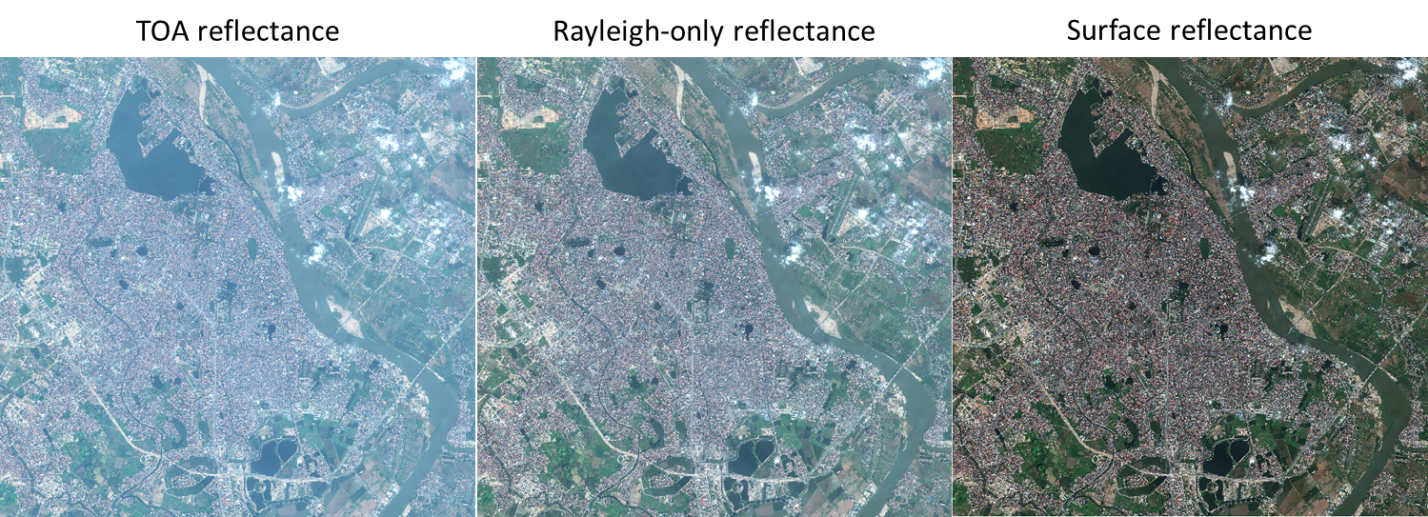 Figure 2: Hanoi, Vietnam. WorldView-2 acquired on February 9, 2010. Average visibility = 14.4 km.[/caption]
[caption id="attachment_6088" align="aligncenter" width="789"]
Figure 2: Hanoi, Vietnam. WorldView-2 acquired on February 9, 2010. Average visibility = 14.4 km.[/caption]
[caption id="attachment_6088" align="aligncenter" width="789"]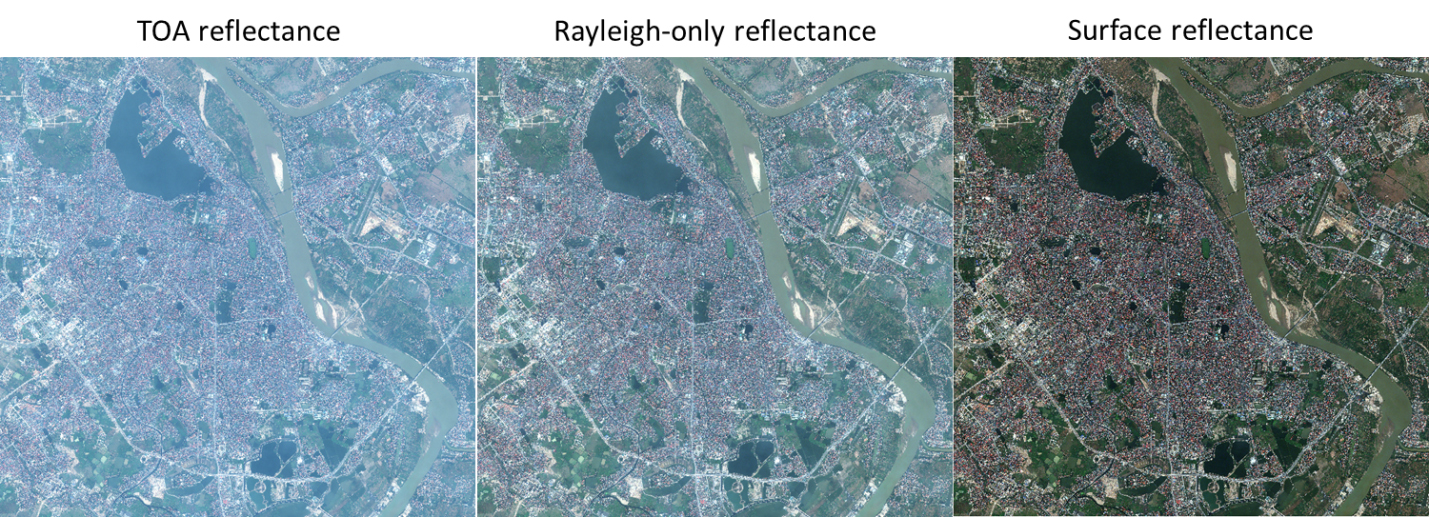 Figure 3: Hanoi, Vietnam. WorldView-2 acquired on December 27, 2010. Average visibility = 14.9 km.[/caption]
[caption id="attachment_6089" align="aligncenter" width="756"]
Figure 3: Hanoi, Vietnam. WorldView-2 acquired on December 27, 2010. Average visibility = 14.9 km.[/caption]
[caption id="attachment_6089" align="aligncenter" width="756"]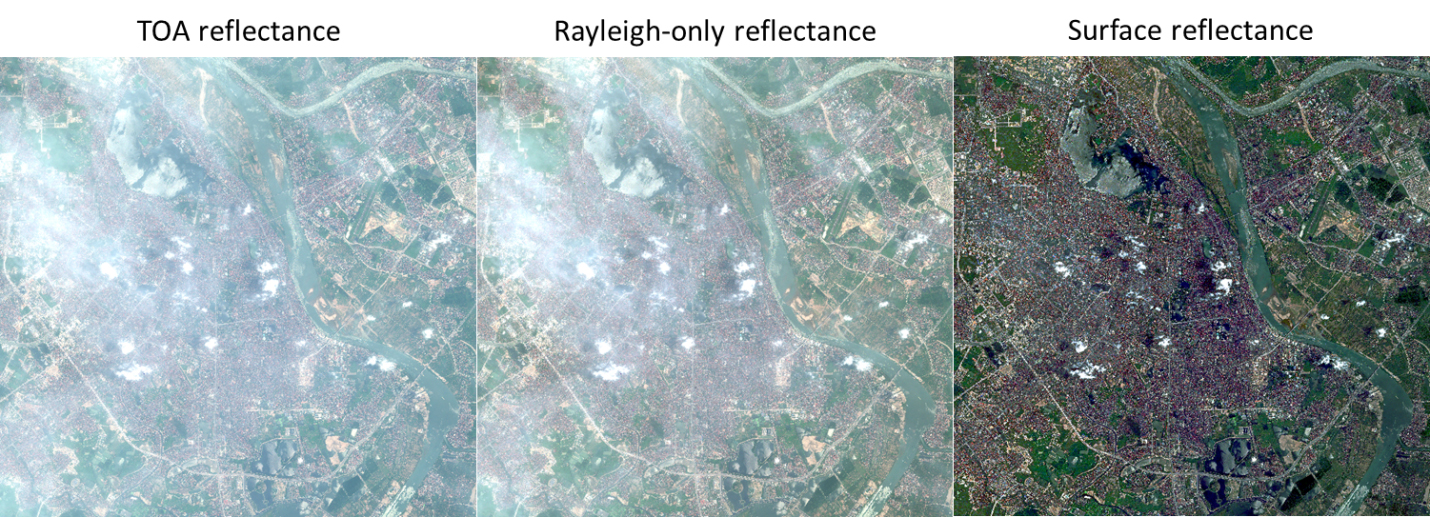 Figure 4: Hanoi, Vietnam. WorldView-2 acquired on April 28, 2012. Average visibility = 8.6 km.[/caption]
[caption id="attachment_6090" align="aligncenter" width="756"]
Figure 4: Hanoi, Vietnam. WorldView-2 acquired on April 28, 2012. Average visibility = 8.6 km.[/caption]
[caption id="attachment_6090" align="aligncenter" width="756"]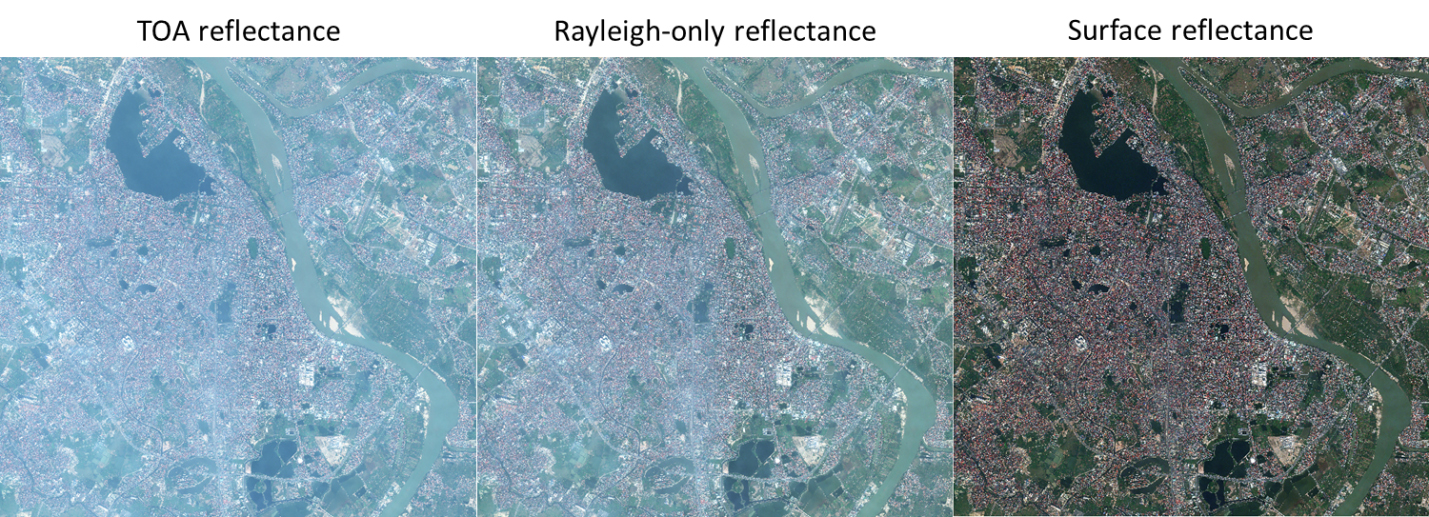 Figure 5: Hanoi, Vietnam. WorldView-2 acquired on December 3, 2013. Average visibility = 12.7 km.[/caption]
The TOA reflectance images look bluer than both Rayleigh-only and surface reflectance. There’s also not much consistency to true values from date to date, making seamless mosaicking nearly impossible. The Rayleigh-only reflectance images appear less blue than TOA reflectance, but colors are still not vivid since they are greatly attenuated by haze (limiting, for example, the stability of luminosity/contrast). Again, there is little consistency across dates. Only surface reflectance offers vivid, true colors across dates and atmospheric conditions.
Accuracy Matters
To perform accurate surface-reflectance correction, you need to do a pixel-based approach that normalizes the values by using the atmospheric (i.e., aerosols) information derived from the collection itself, guaranteeing the most accurate compensation. Using secondary atmospheric data not collected at the same moment of the imagery will provide inaccurate atmospheric measurements that will impact the quality of the compensated image. Only DigitalGlobe uses a true pixel-based surface reflectance approach that normalizes values by using actual atmospheric information derived from the original collection.
DigitalGlobe’s AComp capability is not limited to our own imagery. It can also be applied to third-party data captured by Sentinel-2, Landsat-8 and others. Figure 6 illustrates another comparison between TOA, Rayleigh-only and surface reflectance in a Sentinel-2A image acquired on May 22, 2016 over northwest Italy, a region where hazy conditions are common. Yet again, only the surface-reflectance transformation produces a uniform, vibrant image.
[caption id="attachment_6091" align="aligncenter" width="679"]
Figure 5: Hanoi, Vietnam. WorldView-2 acquired on December 3, 2013. Average visibility = 12.7 km.[/caption]
The TOA reflectance images look bluer than both Rayleigh-only and surface reflectance. There’s also not much consistency to true values from date to date, making seamless mosaicking nearly impossible. The Rayleigh-only reflectance images appear less blue than TOA reflectance, but colors are still not vivid since they are greatly attenuated by haze (limiting, for example, the stability of luminosity/contrast). Again, there is little consistency across dates. Only surface reflectance offers vivid, true colors across dates and atmospheric conditions.
Accuracy Matters
To perform accurate surface-reflectance correction, you need to do a pixel-based approach that normalizes the values by using the atmospheric (i.e., aerosols) information derived from the collection itself, guaranteeing the most accurate compensation. Using secondary atmospheric data not collected at the same moment of the imagery will provide inaccurate atmospheric measurements that will impact the quality of the compensated image. Only DigitalGlobe uses a true pixel-based surface reflectance approach that normalizes values by using actual atmospheric information derived from the original collection.
DigitalGlobe’s AComp capability is not limited to our own imagery. It can also be applied to third-party data captured by Sentinel-2, Landsat-8 and others. Figure 6 illustrates another comparison between TOA, Rayleigh-only and surface reflectance in a Sentinel-2A image acquired on May 22, 2016 over northwest Italy, a region where hazy conditions are common. Yet again, only the surface-reflectance transformation produces a uniform, vibrant image.
[caption id="attachment_6091" align="aligncenter" width="679"]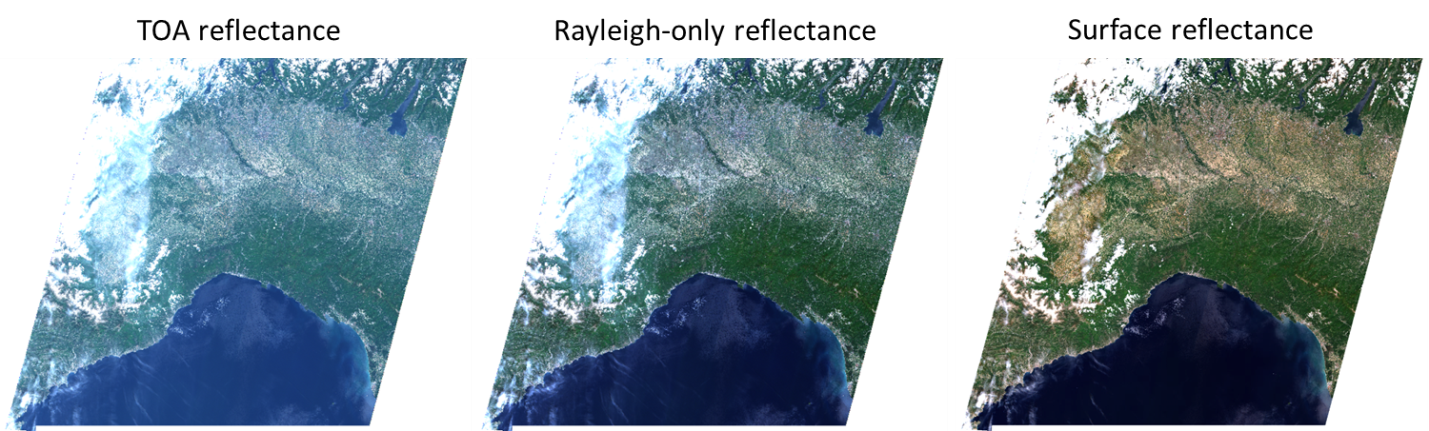 Figure 6: Northwest Italy. Sentinel-2A acquired on May 22, 2016. Average visibility = 33.8 km.[/caption]
To really illustrate this point, Figure 7 shows what you get when you combine the whole Landsat-8 archive with AComp to produce a seamless, cloud-free mosaic of the entire world.
[caption id="attachment_6092" align="aligncenter" width="707"]
Figure 6: Northwest Italy. Sentinel-2A acquired on May 22, 2016. Average visibility = 33.8 km.[/caption]
To really illustrate this point, Figure 7 shows what you get when you combine the whole Landsat-8 archive with AComp to produce a seamless, cloud-free mosaic of the entire world.
[caption id="attachment_6092" align="aligncenter" width="707"]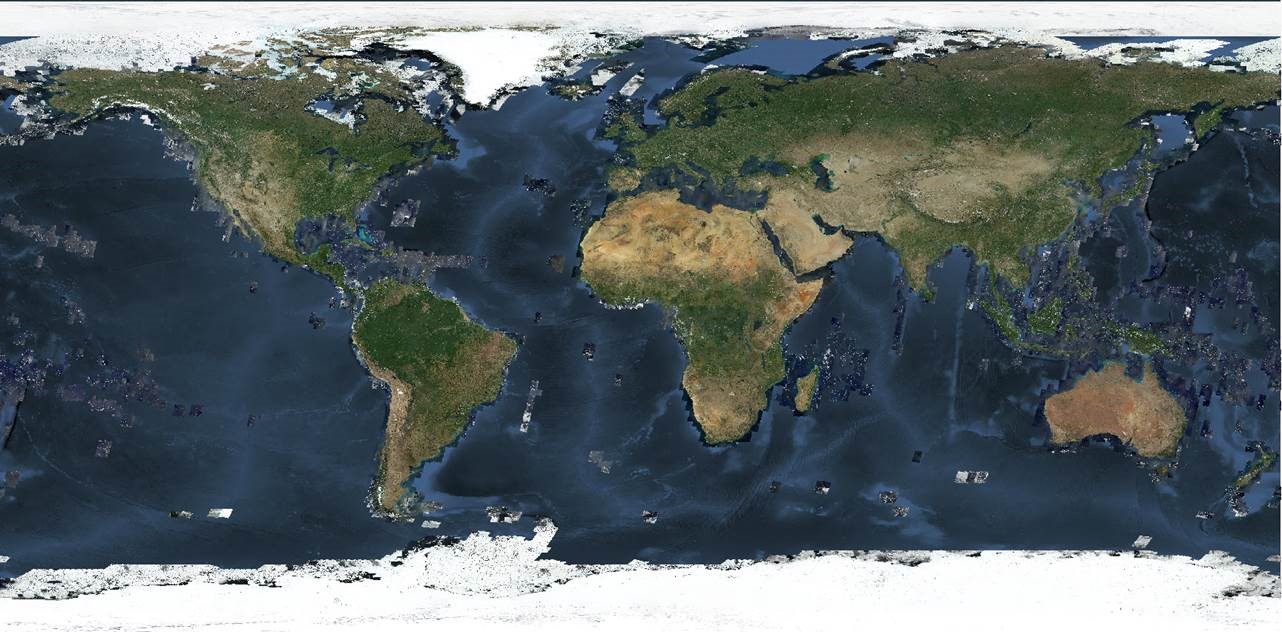 Figure 7: Surface reflectance mosaic derived from AComp-ed Landsat-8 images.[/caption]
Empowering Solutions with Precision
Why does AComp matter? It’s more than just making prettier pictures. The accurate analysis of satellite images depends upon the ability to distinguish between relevant and non-relevant features on the Earth’s surface through time. Many of the solutions we make possible involve deep learning applications, large-scale mosaicking and change-detection mapping—all of which require precise data to avoid rework. When asked how to minimize the likelihood of processing issues, I generally advocate the use of atmospherically compensated satellite data over raw data.
DigitalGlobe’s proprietary AComp methodology is a comprehensive solution that’s unmatched in the industry. No other provider uses a pixel-based approach that incorporates real atmospheric data instead of “best guesses.” This capability aligns with DigitalGlobe’s mission to be the indispensable source of geospatial data, providing customers with the most exacting, mission-critical information available about our changing planet.
Want to learn more? Visit our AComp page for a deeper dive and to download more samples.
Figure 7: Surface reflectance mosaic derived from AComp-ed Landsat-8 images.[/caption]
Empowering Solutions with Precision
Why does AComp matter? It’s more than just making prettier pictures. The accurate analysis of satellite images depends upon the ability to distinguish between relevant and non-relevant features on the Earth’s surface through time. Many of the solutions we make possible involve deep learning applications, large-scale mosaicking and change-detection mapping—all of which require precise data to avoid rework. When asked how to minimize the likelihood of processing issues, I generally advocate the use of atmospherically compensated satellite data over raw data.
DigitalGlobe’s proprietary AComp methodology is a comprehensive solution that’s unmatched in the industry. No other provider uses a pixel-based approach that incorporates real atmospheric data instead of “best guesses.” This capability aligns with DigitalGlobe’s mission to be the indispensable source of geospatial data, providing customers with the most exacting, mission-critical information available about our changing planet.
Want to learn more? Visit our AComp page for a deeper dive and to download more samples.