Today, we are pleased to announce the winners of the Maxar Spatial Challenge, a contest designed to encourage collaboration to find new sustainable solutions to address Australia’s biggest challenges. This challenge was hosted in partnership with Arlula, an online platform that provides users with simple and affordable access to remote sensing data, and Consilium Technology, a team offering professional consulting services and intelligent software solutions.
114 participants on 44 teams leveraged Maxar’s high-resolution satellite imagery and platform, along with other information sources, to build solutions for two categories: urban spaces and regional spaces. Here is an introduction to the winners:
Regional Spaces Category
1st Prize Winner:

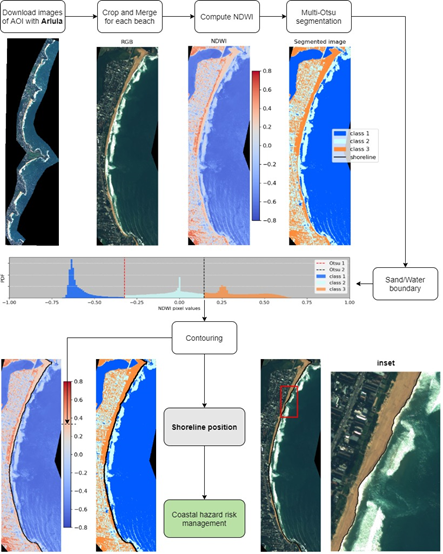
The above flowchart describes the methodology developed to extract the position of the shoreline.
Project: Real-time coastal shoreline monitoring built on Maxar imagery
Solution: This team set out to provide a real-time beach monitoring product to inform coastal planners about potential coastal hazards and support sustainable management of our coastline. Their solution uses a detection algorithm to extract the shoreline from Maxar’s imagery and displays the information in a dynamic, user-friendly dashboard that will enable a broad range of coastal engineering and management applications around Australia.
Team name: Remote Sensing Ninjas from University of New South Wales, Sydney Water Research Laboratory
Members: Kilian Vos, Yarran Doherty, Christopher Drummond, Valentin Heimhuber
Data used: Maxar 15 cm high-definition (HD) imagery
2nd
Prize Winner:

The above image on the left shows an area affected by a bush fire. The image on the right shows the land classified by what’s happening on the ground.
Project: How can high-resolution satellite imagery be leveraged to better model biomass carbon?
Solution: This concept involves three methods:
1. Analyze Maxar imagery from before and after a bush fire.
2. Quantify the fire scarring using the Full Carbon Accounting Model (FullCAM) software, a calculation tool for modelling Australia’s greenhouse gas emissions from the land sector.
3. Calculate changes in forest cover by using machine learning to count trees on agricultural land in Maxar satellite imagery in GBDX Notebooks.
Combining the resulting data allows the team to determine carbon sources and sinks, as well as other changes in greenhouse gases. This information enables better monitoring of carbon projects, restoration activities and bush fire recovery efforts.
Team: Restore Australia from Global Evergreening Alliance
Members: Nicholas Metherall, Sam Brown-Kenyon, Tobias Gunn
Technology used: GBDX platform
3rd Prize Winner:
Project: Murray Darling Basin catchment monitoring
Solution: This team investigated using Maxar HD imagery as part of a suite of products to manage water systems in the Border Rivers of Queensland, Australia, which form part of the headwaters of the Murray Darling Basin.
Utilizing various datasets on waterflow events like stream gauge data, a user could potentially model and monitor post-event water usage using land classifications and vegetation indices. Additionally, the clarity of the HD imagery combined with Digital Elevation Models (DEMs) and mapped water infrastructure could provide an excellent visualisation tool, giving the ability to effectively communicate with different stakeholders.
Team: State Imagery, Department of Natural Resources, Mines and Energy (DNRME)
Members: Alistair Quinn, Luke Forbutt, Karin Stronkhorst, Giri Khanal, Mehdi Etemadi, Ana Hipolito
Data used: Maxar 15 cm HD imagery
Urban Spaces Category
1st Prize Winner:

The image above shows Liverpool, New South Wales with trees marked in blue by Canopy Mapper.
Project: Project Canopy Mapper
Solution: The Canopy Mapper uses a machine learning algorithm to detect and mask green tree canopy coverage in ~1m resolution satellite images of urban cityscapes. The mask output identifies if each pixel is part of a tree or not, and then Canopy Mapper calculates a Confidence Coverage Ratio, which over time can track tree coverage growth over time (as shown in the image above). These outputs will allow end users, like city governments, to produce an expert assessment of tree canopy coverage at any time, helping to democratize access to key information for city planning.
Team: Spiral Blue
Members: Timothy Guo, Henry Zhong and Taofiq Huq
Technology used: GBDX platform
2nd Prize Winner:

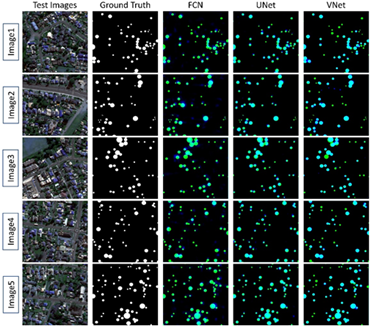
The diagram above displays the tree canopy detection and classification results from the three models tested.
Project: Tree canopy classification, tracking and analysis in the urban settings
Solution: This team’s methodology involved the use of developing a deep learning model to detect and classify tree canopies. The team tested three deep learning models to identify the capability of each model in terms of statistical metrics. The models used were Fully Conventional Networks (FCN), U-Net and V-Net; the statistical metrics used were F1-score, Intersection over Union (IOU) and Matthews Correlation Coefficient (MCC). Results suggest V-Net was the best. The results can be used to develop an inventory of tree canopies, which helps in examining the temporal variation of vegetation. Further, it can identify the various tree species and compute the number of trees.
Team: Tracanopy from the Centre for Advanced Modelling and Geospatial Information Systems (CAMGIS), University of Technology Sydney
Members: Abhirup Dikshit, Abolfazl Abdollahi, Biswajeet Pradhan, Alfredo Huete, Yuxia Liu, Ratiranjan Jena
Data used: Maxar 15 cm HD imagery
3rd Prize Winner:

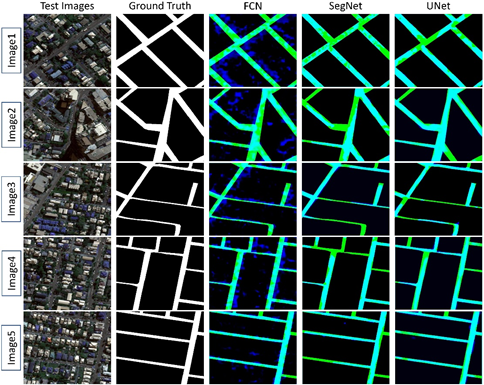
The figure above shows the different results from the various architectures.
Project: Roads and access paths identification and classification
Solution: This team created different deep learning architectures (FCN, SegNet and U-Net) to classify road networks from Maxar images of Brisbane areas. This methodology can be used by city planners for emergency tasks, land use change mapping and automatic road navigation. It can also be used for updating geographic information systems (GIS) maps.
Team: Road Mining from the Centre for Advanced Modelling and Geospatial Information Systems” (CAMGIS), University of Technology Sydney
Members: Abolfazl Abdollahi, Biswajeet Pradhan, Nagesh Shukla, Subrata Chakraborty
Data used: Maxar 15 cm HD imagery
Winners will receive prizes valued more than AUD 30,000 ranging from cash to archive imagery to internship/research support.