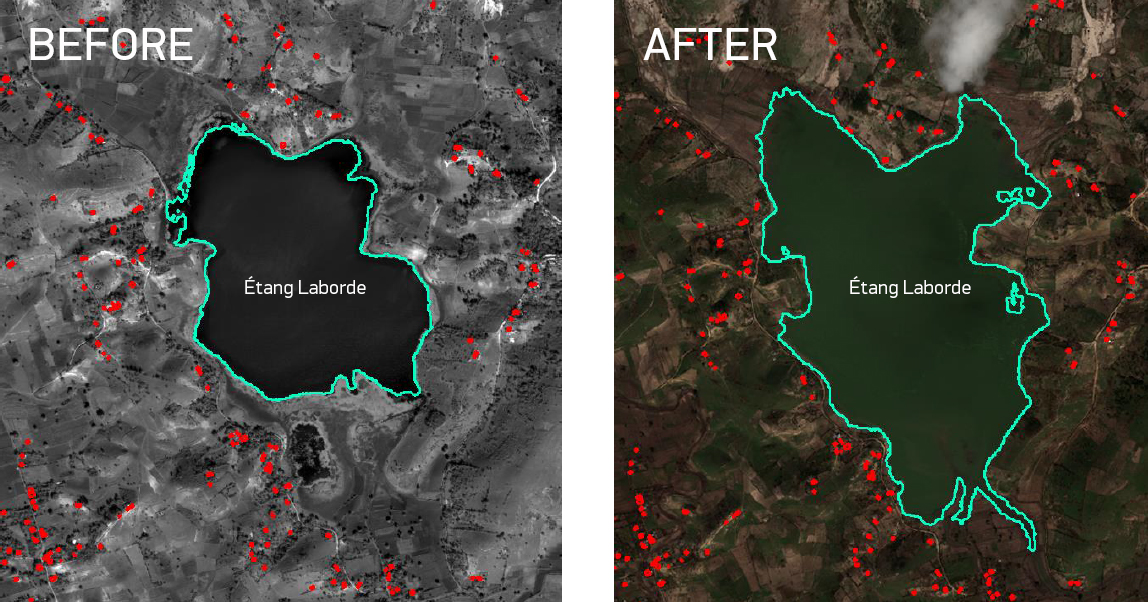
 The lake’s area has grown significantly in the hurricane’s wake. Now, you can see that structures (represented by red dots) that were previously safe are now at risk of flooding.
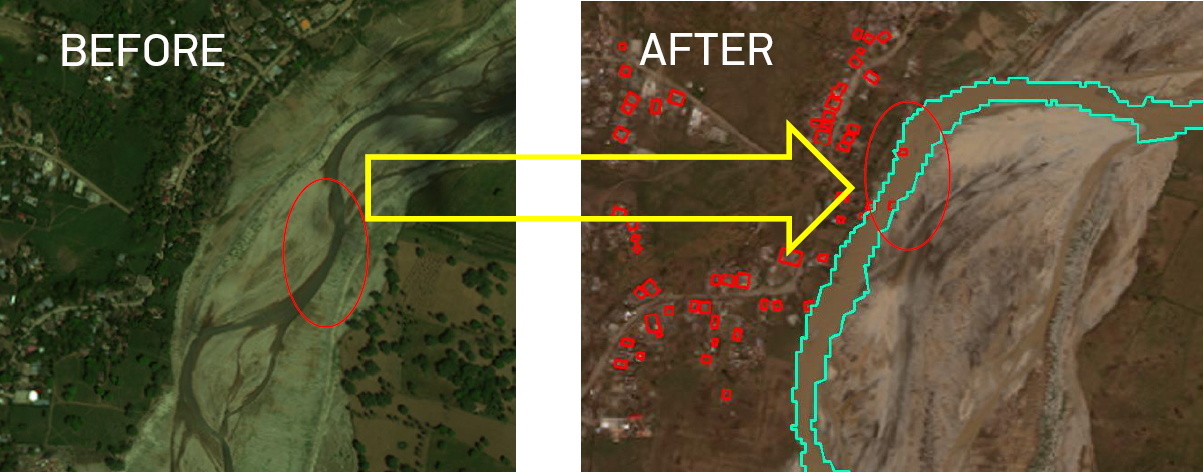 In some cases, a body of water doesn’t just grow—it completely changes course. In the pre-storm image above, you can see that the river in Les Anglais, Haiti had a wide bow that bent away from the structures in the left side of the frame. Now, after the storm, the blue lines of our water mask show that the river’s course has changed completely.
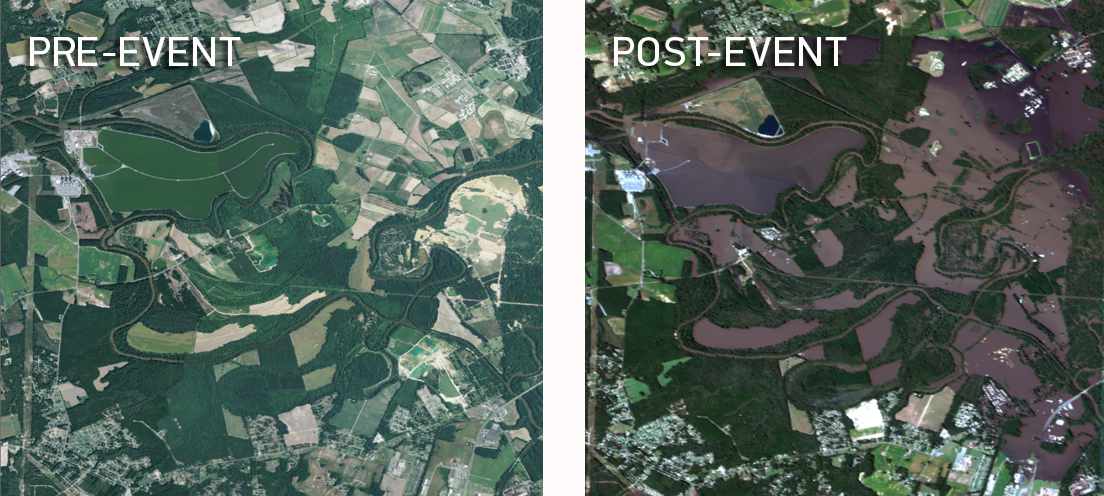
 The ability to determine exactly what infrastructure is underwater is one of the most powerful applications of GBDX for disasters like Hurricane Matthew. Analyzing this information at scale is no trivial task and automating the steps of taking pre-event imagery all the way to post-event plus meaningful insight is not easy. In the above four images of an area of Goldsboro, North Carolina, we step through the process of turning the imagery into something actionable.
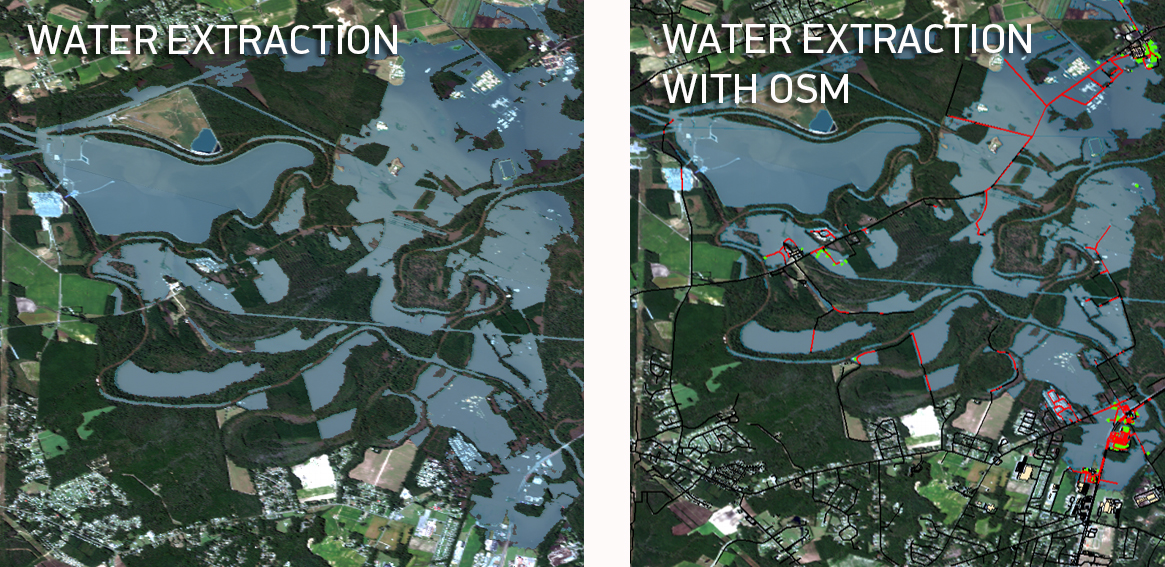
How many structures have been impacted—and to what extent is the road damaged, too? Using the GBDX-ArcMap add-in, we can pull in water vectors and query for OSM features that are within the water. With this extraction, we get an output of the specific impact within the AOI:
The ability to determine exactly what infrastructure is underwater is one of the most powerful applications of GBDX for disasters like Hurricane Matthew. Analyzing this information at scale is no trivial task and automating the steps of taking pre-event imagery all the way to post-event plus meaningful insight is not easy. In the above four images of an area of Goldsboro, North Carolina, we step through the process of turning the imagery into something actionable.
How many structures have been impacted—and to what extent is the road damaged, too? Using the GBDX-ArcMap add-in, we can pull in water vectors and query for OSM features that are within the water. With this extraction, we get an output of the specific impact within the AOI:
 From counting the number of impacted structures to showing change over time, there’s so much more that GBDX can do with these FirstLook images. If you’re working in the affected areas, let us know what else you’re looking for and we’ll do our best to engineer accurate, cost-effective solutions.