Vegetation mapping, monitoring and characterization are some of the most important and prolific exercises that employ satellite image processing in the agriculture and environmental monitoring sectors. Scientists can determine the presence, health and vigor, and seasonal variations of vegetated features from space.
Many vegetation indexes have been developed. By far, the most popular is Normalized Difference Vegetation Index (NDVI). Variations of this index concentrate on reducing background noise due to influences from atmosphere or soil. Another version, Normalized Difference Red Edge index (NDRE), was created to monitor crops or trees later in the growing season, particularly when plants have low chlorophyl content.1
There are limits to how well vegetation can be characterized from satellite imagery. These indexes are great at understanding if vegetation exists at a location and if the vegetated features are healthy—but they are not as effective at understanding the stage of growth, height or density of plants reliably from a single high-resolution image.
I developed an algorithmic measurement based on plant texture and chlorophyll content. Texture is useful for determining difference in height among features in imagery; Maxar’s sophisticated texture measurement is tuned particularly well to plants. By itself, the texture measurement cannot be used to identify vegetated versus nonvegetated features. And by itself, a vegetation index cannot tell the difference between short and tall vegetation. Used together in a novel way, Maxar’s texture measurement and a vegetation index can identify vegetative features and determine the density and height of the vegetation— we call that result TexVeg. This is a great way to monitor vegetation for growth, which is beneficial to the energy and agriculture industries for a variety of use cases that I will outline in this blog post.
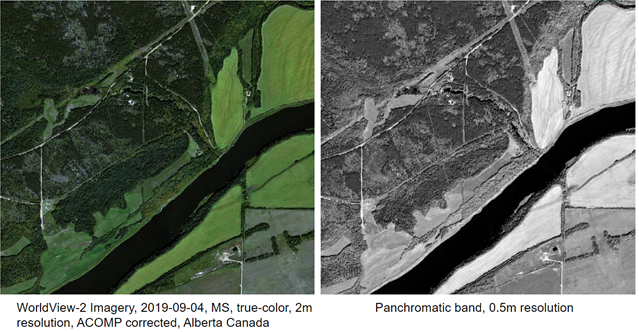
The Maxar WorldView-2 image displayed with multispectral bands (left) and panchromatic bands (right).

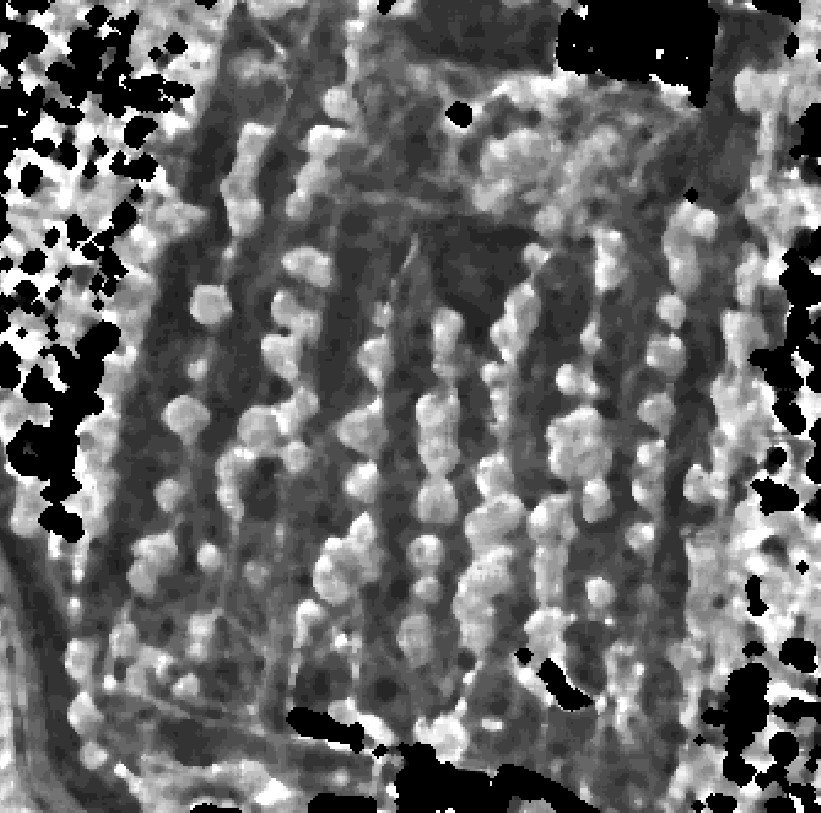
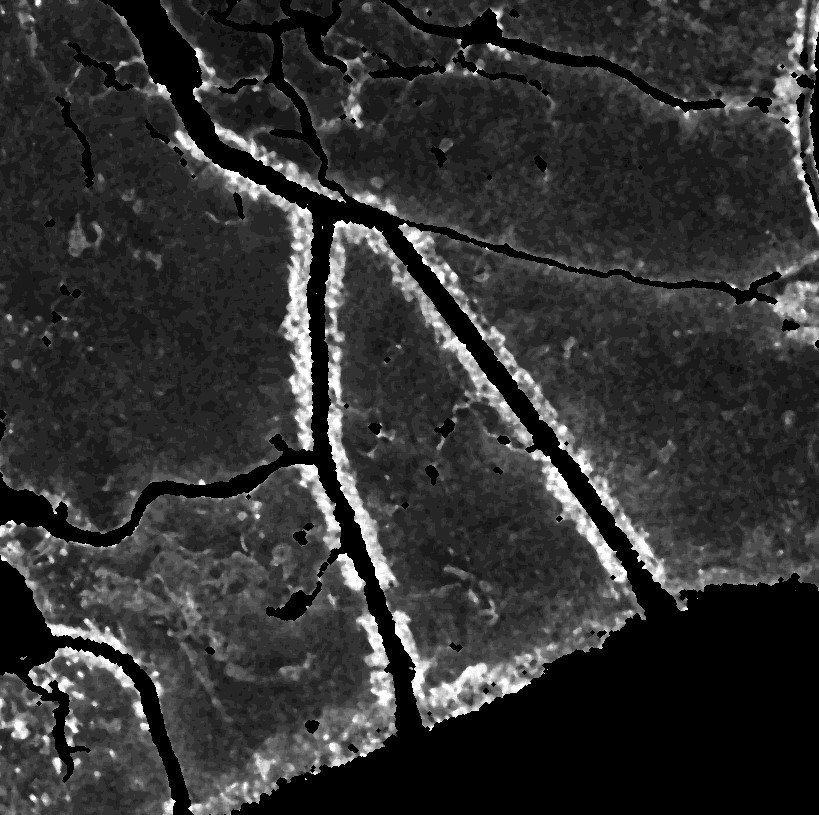
NDVI (left) and Maxar texture measurement (right) derived from the WorldView-2 image.

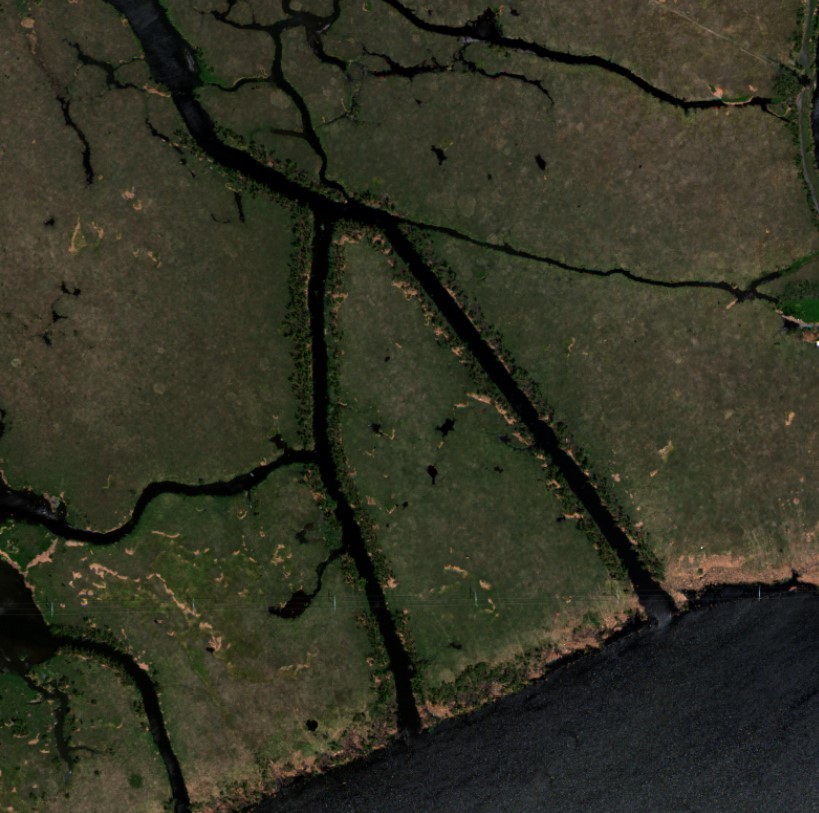
The two previous images are inputs in the creation of the TexVeg layer output (right). The multispectral WorldView-2 image on the left is provided for comparison.
Click through this gallery to see how one Maxar WorldView-2 image of Alberta, Canada, can be analyzed with the TexVeg process.
TexVeg results
The TexVeg output is an 8-bit layer that ranges 0-100: 0 is no vegetation, and 100 is mature trees (see image below). Low values represent short grasses and immature vegetation and are assigned a darker shade. Medium values represent vegetated features with some height and texture to them, such as tall grass, shrubs and small trees; these values are displayed as medium gray shades. High values represent mature trees and show up as the lightest shades. Output resolution is 2 m by 2 m.

Three levels of vegetative height and the corresponding TexVeg return.
TexVeg is effectively run only with imagery that includes bands with near-infrared and visible spectra and a higher-resolution panchromatic band. It is a multiresolutional approach. The multispectral bands must be accurately transformed to bottom surface reflectance. Imagery should be collected during leaf-on dates. All Maxar imagery (except for WorldView-1) is perfectly suited as input to the TexVeg algorithm.

This golf course near New Orleans, Louisiana, provides a prime example of the benefits of TexVeg. The Maxar WorldView-2 multispectral image on the left allows the end user to see that grass and trees are present, but the TexVeg output on the right provides details about the height and density of the vegetation.
What can TexVeg be used for?
Maxar has applied TexVeg to a handful of use cases, including:
- Utility corridor monitoring: helping customers understand when vegetation under powerlines needs to be trimmed
- Illicit crop identification: finding and quantifying yields of illegally grown vegetation
- Well pad restoration monitoring: allowing customers to ensure vegetation is regrowing after capping a depleted oil well without needing a site visit to confirm growth status
These studies cannot be completed with traditional vegetation indexes alone, because the indexes indicate solely the presence of plants. To gain insights like these studies require, the end user needs to know that vegetation exists in the area, how many plants are growing and the stage of growth—information provided only by TexVeg.
There are known issues with the TexVeg process. If vegetation is grown in a tight linear arrangement, the TexVeg output can indicate plants taller than what’s really on the ground. For example, a vineyard may return TexVeg values more associated with mature trees. Separately, cloud and terrain shadows can diminish contrast and return lower values than expected.

TexVeg (left) automatically identified vegetation encroaching (in red) in a utility corridor as seen in the Maxar WorldView-2 image on the right. This derived information allows a utility customer to focus its clearing crews on specific corridors that have reached a height threshold of encroaching vegetation. This saves money by reducing the need for ground surveys.

TexVeg layer (left) measures crops by height using the WorldView-2 near-infrared image (right), allowing an end user to determine there are different crops planted in the same field. In a near-infrared image, healthy vegetation shows up in red.

In the images above, the two fields on the left are growing wheat and the two fields on the right are growing grape vines with a grass understory. The TexVeg output on the left demonstrates the ease of differentiating between the two crops. The WorldView-2 image on the right uses the near-infrared spectrum to show healthy vegetation in red.
These examples show Maxar WorldView-2 images with corresponding TexVeg outputs.
How well does TexVeg work?
Use the slider above to see the insights revealed by TexVeg. It’s difficult to ascertain the vegetation differences in the multispectral image, but TexVeg allows the end user to determine there is taller vegetation growing along the banks of the canals.
ExxonMobil recently led a study2 to evaluate TexVeg for predicting stem density (how many plants are growing back during revegetation efforts) using ground-collected reference data. Compared to five other popular indexes, TexVeg was found to be the best predictor.
The full peer-reviewed article is published online.
Read moreFuture developments for TexVeg
Ongoing and future studies will seek to calibrate TexVeg outputs more precisely for multidate comparisons. Also, a method for establishing vegetation height directly from TexVeg and sun and sensor angles is being determined and assessed with ground-collected reference information. Finally, Maxar will work with the University of Maryland to determine the relationship of TexVeg to biomass measurements for carbon and climate studies.
To learn more about TexVeg or evaluate it for your project, contact us.
References
- Boiarskii, B., Hasegawa, H. Comparison of NDVI and NDRE Indices to Detect Differences in Vegetation and Chlorophyll Content. International Conference on Applied Science, Technology and Engineering J. Mech. Cont.& Math. Sci., Special Issue, No.-4, November (2019), pp 20-29 DOI: 10.26782/jmcms.spl.4/2019.11.00003
- Ireland, A.W., Smith, F.G.F., Jaffe, B.D., Palandro, D.A., Mercer, S.M., Liu, L., Renton, J. Field experiment demonstrates the potential utility of satellite-derived reflectance indices for monitoring regeneration of boreal forest communities. Trees, Forests and People. December 2021, Vol 6. DOI: 10.1016/j.tfp.2021.100145.