The concept of artificial intelligence and machine learning (AI/ML) aiding an analyst in accomplishing their job more quickly is commonly discussed in the geospatial industry, but generally at a high level and in the context of looking at one image. What happens when an analyst starts receiving up to 15 images of one place every day–and they’re responsible for monitoring multiple places? When massive amounts of geospatial data are coming in to be examined, a whole team of analysts–forget about a single analyst–won't have the bandwidth to thoroughly examine all of the data and create actionable insights.
We’re going to walk you through the process of one image, so you get a taste of it and can easily understand why AI/ML earns a place as a required part of an analyst’s workflow.
Scenario
At the start of the day, the analyst receives a list of locations to monitor and things to look for in broad areas. The first task the analyst must complete is monitoring vehicles around the Hyundai manufacturing plant in Ulsan, South Korea. The completed cars are stored in surface lots outside and parked closely together. A new 30 cm high-resolution image from Maxar’s WorldView-3 satellite came in this morning, and the analyst needs to figure out how many cars are in the lot and compare it to the inventory from previous days.
Manually counting cars
Insert yourself into the analyst’s job. The image is in this slippy map–zoom in and out as needed. Count the cars, including partial views of cars, that are inside the red square and type your number into the box below to see how close you are.
How long did that take you?
Now when we set out to write this blog post, we counted these cars too. Adam ended up with 1117 cars and Joe had 1129 cars. We had Joe’s team of highly trained data scientists count the cars manually and they ended up with 880, 883, 953, 1013 and 1049. Adam’s mom and niece played along too and ended up with 1041 and 1182 cars, respectively. And it took each person anywhere from 20 minutes to 30 minutes.
There’s a reason why everyone ended up with different numbers: some judged shadows as cars, thought they saw a partial car here or there, or skipped one because it didn’t look like a car to them. Take this example:
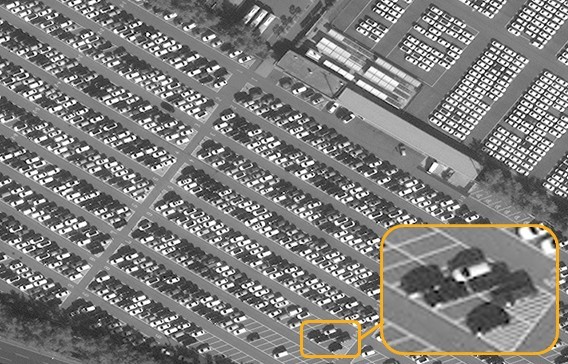
Zooming into this one part of the parking lot above causes quite the arguments. Are there five cars here or six? Some say they can see the shadow of something between the white car and dark car on the right side of the image, so a car must be there. But others say the parking space is clearly empty. The assessment of whether or not a car is there is highly subjective. A human must make these decisions–and this is using the highest resolution satellite imagery commercially available. Check out what happens to the image as the resolution downgrades to 80 cm imagery and it gets harder to distinguish individual cars, let alone shadows and partial cars:
Applying artificial intelligence to counting cars
The analyst has access to Maxar’s DeepCore machine learning engine that runs algorithms trained to count cars on Maxar imagery, which in this case is a 30 cm WorldView-3 satellite image. He runs the algorithm on the same WorldView-3 image, examining one square kilometer in a fraction of a second. Instead of the average 25 minutes it took humans to count the cars, the algorithm generates its output (below) in less than half a second: 1,267 cars.
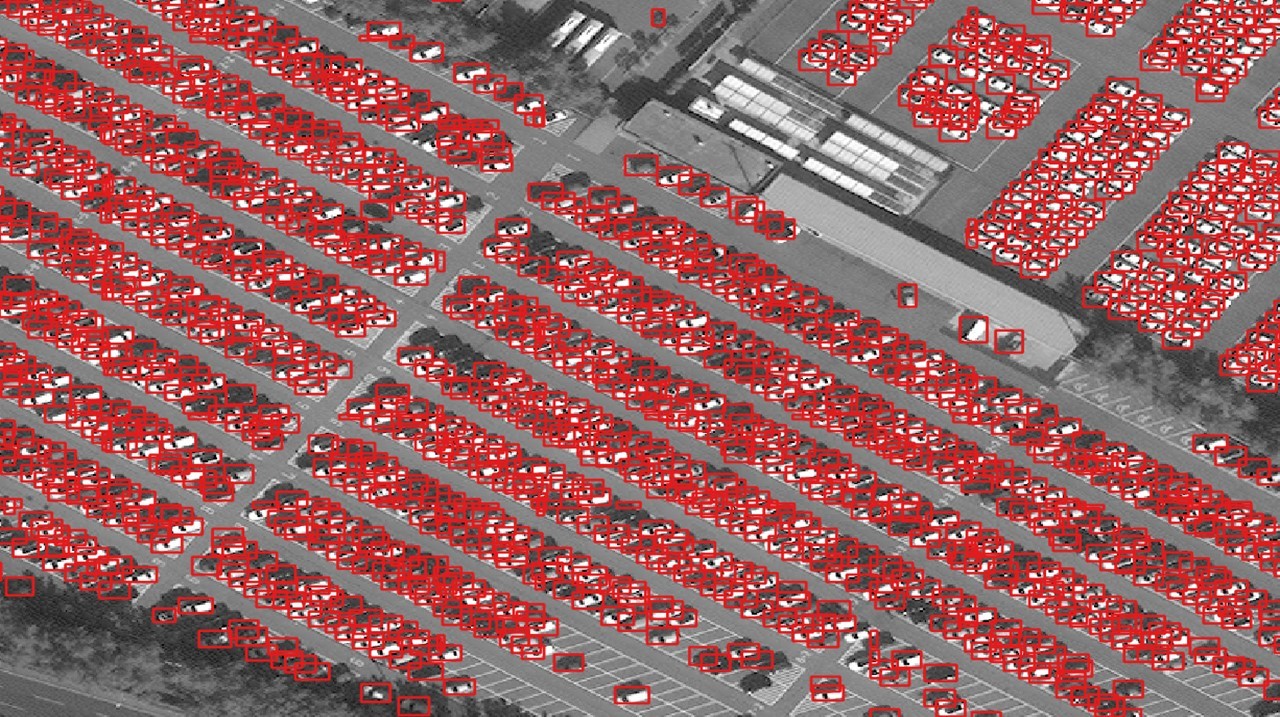
While the algorithm has generated yet another estimate of cars, it is in the ballpark of what the humans counted. The value in the algorithm is that it calculated its answer 150 times faster than just one human, let alone the half a dozen or so humans we had count cars to get a median number.
WorldView Legion data will compel analysts to leverage AI to their advantage
When Maxar’s WorldView Legion satellites start launching in the first half of 2021, they will enable Maxar to provide up to 15 high-resolution images of a location in a single day. An analyst doesn’t have time in one shift to count the cars manually in each of those 15 images. But, they have plenty of time to run all 15 images through DeepCore’s car counting algorithm for an almost exactly right number, notice patterns and trends about when the numbers of cars change and investigate the cause, creating mission-critical information for influencing decisions.
One factor is key to relying on AI/ML for helping analysts manage the massive influx of data that will be generated from Maxar’s expanded constellation: resolution. Just as humans had to make a judgement call about whether they saw a sixth car or a shadow, the algorithms have to be trained to do the same thing. And when the resolution gets worse, the algorithm has less information to work with. Watch this GIF to see how the algorithm’s estimates got worse as the resolution degraded.
As an analyst has increased access to industry-leading satellite imagery, they are going to need to leverage AI/ML to focus their attention on where action is happening, especially if they are assigned to monitor multiple locations. That’s why Maxar employs more than 1,000 data scientists and geospatial analysts—to help anticipate and solve complex problems for our customers.
If you’d like to join Maxar’s team working on challenges like this, check out our Careers page for open positions.