SecureWatch, Maxar’s cloud-based subscription service for on-demand access to satellite imagery and Earth Intelligence, now includes Maxar’s patented Persistent Change Monitoring (PCM) information layer with premium subscriptions.
PCM is an image-based change detection capability that uses scale- and sensor-independent algorithms to highlight areas of human activity and other change. “Persistent change” refers to any change to the Earth’s landmass that becomes permanent. New building construction is an example of persistent change, while vegetation varying with the seasons is not. By drawing immediate attention to areas of change, PCM eliminates the need to manually scan imagery, saving up to 90% of the costs for an analyst to update and maintain its catalogue of geospatial infrastructure. Here are a few examples where PCM can be an integral component of an analyst’s workflow:
Use Case #1: Illegal Deforestation and Mining in Peru
A steep and steady rise in international gold prices in the last 20 years has fueled a mining boom throughout the Amazon River basin1. Informal gold mining operations work without permits or approved environmental impact studies, causing destruction to the surrounding environment and human populations. Deforestation, air pollution and water contamination with mercury, arsenic and cyanide are common environmental threats in these mining operations2.
Peru is the largest importer of mercury in South America3–most of it is used to meet the demands of gold mining operations in Madre de Dios. Proclaimed to be the Peruvian “Capital of Biodiversity”2, the region has a unique richness of indigenous cultures, plants and animals2. Deforestation and environmental degradation as a result of the gold rush has plagued the region in the last two decades. According to our measurements, in the period from 2000 to 2019, nearly 90,000 hectares of lowland rainforest was deforested, leaving a visible imprint on the banks of the Inambari, Caychihua and Madre de Dios rivers.
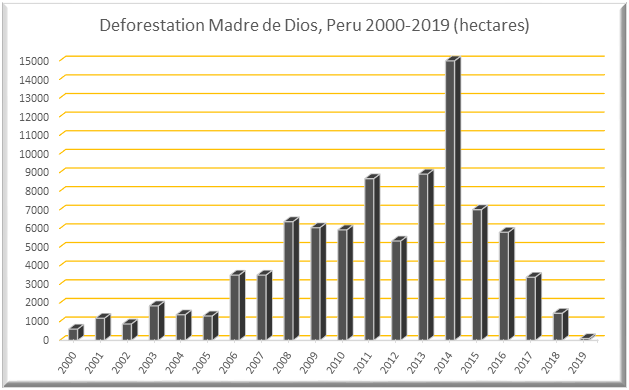
PCM enables users to understand trends in environmental degradation and measure the rates of deforestation year-by-year, as well as the directionality of future change. Because PCM runs on top of frequently refreshed, global-scale Sentinel-2 and Landsat satellite data, the information layer provides analysts with a powerful tipping and cueing mechanism for further research with high-resolution Maxar imagery or other assets, reducing both time and costs when updating geospatial assets.

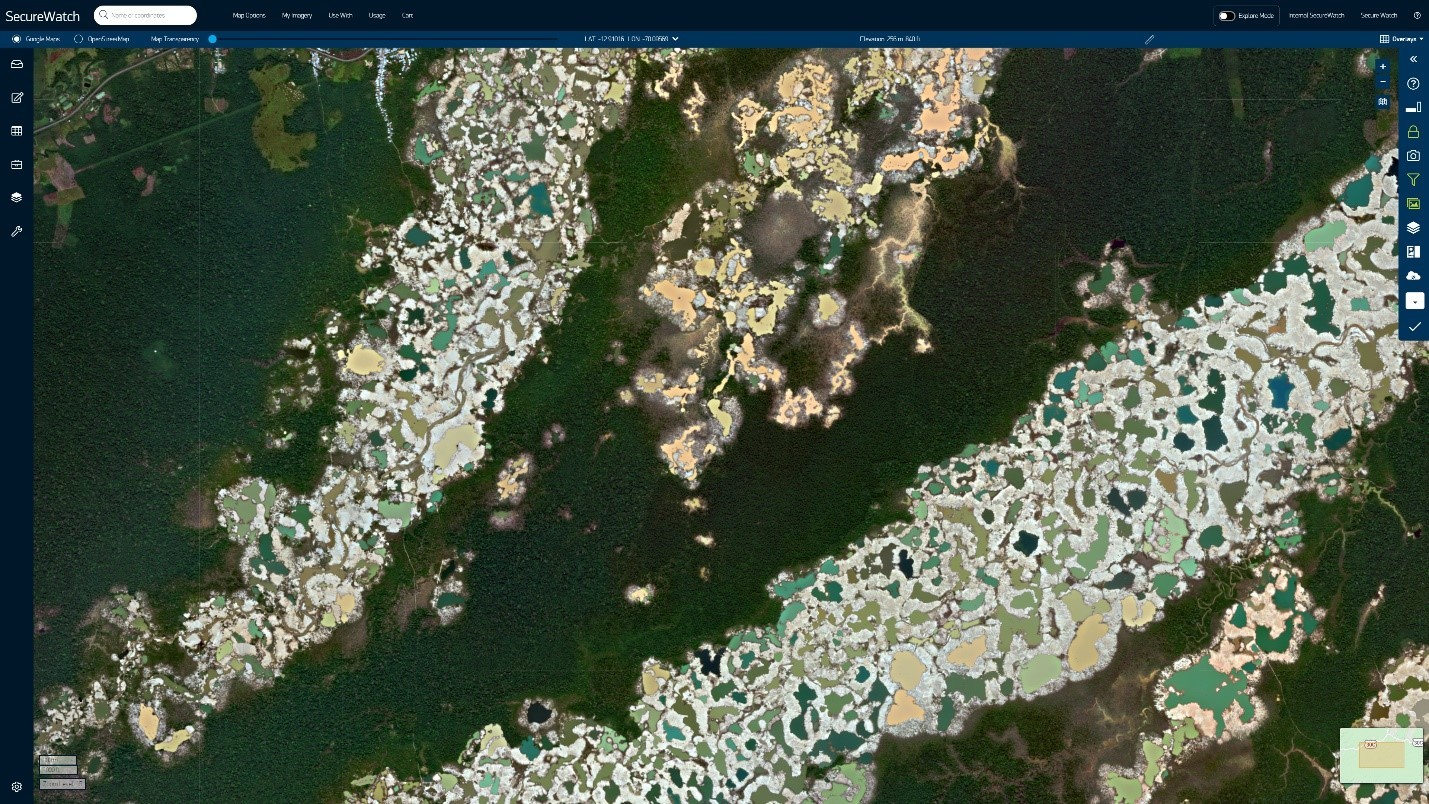
In this SecureWatch screenshot, PCM is visualized over an area of the Inambari District of Peru, showing where change happened between 2000 and 2019.

The slider above shows the same area of Inambari District of Peru. The WorldView-2 image on the left is from May 13, 2016, and the GeoEye-1 image on the right is from September 9, 2020, after an increase in mining activity.
Use Case #2: Construction of Olympic Venues in Tokyo
Tokyo will host the games of the XXXII Olympiad starting on July 23, 2021, unfortunately postponed a year due to COVID-19. In preparation, Tokyo demolished older stadiums and built new venues; PCM documented these changes. PCM is designed to record the spatio-temporal nature of construction and is an indispensable tool for monitoring construction operations and updating geospatial infrastructure.

In this image of Tokyo, the PCM polygons are color coded to indicate the year when construction was confirmed by at least three temporal observations.
Let’s look closer at one particular part of Tokyo: the Ariake Olympic Gymnastics Centre. In the slider below, you can compare a WorldView-3 image from January 7, 2017 (left side) and a GeoEye-1 image from May 17, 2020 (right side).


Use Case #3: Monitoring Oil & Gas Infrastructure
The Permian Basin in West Texas and southeastern New Mexico is one of the largest reservoirs of oil and natural gas in the world. Beginning in 1993, almost 15 billion barrels of oil of have been produced in this area. The Texas cities of Midland, Odessa and San Angelo serve as the headquarters for oil production activities in the basin. PCM clearly identifies the proliferation of oil and gas infrastructure year-by-year, telling the story of accelerated regional development. It is also a great tool to use for monitoring pipeline corridors to meet the regulatory requirements demanded of the oil and gas sector.


The image on the left was captured by WorldView-3 on November 30, 2016. The image on the right is from WorldView-2 on August 29, 2020. While you can tell that there has been significant construction in this area north of Odessa, Texas, you don’t know when it’s happened. The PCM visualization below provides that information.

PCM highlights the yearly growth of oil and gas infrastructure north of Midland, Texas.
The capability to visualize PCM is now available to SecureWatch Premium subscribers. It is made available via the web application or through the SecureWatch Web Map Services (WMS). Additionally, Maxar offers PCM as a stand-alone, offline product with robust metadata and complete attribution unlocking the ability to perform more in-depth analysis. Log in and follow this tutorial to begin accessing PCM data within SecureWatch today.
If you do not currently have a SecureWatch Premium account, visit the SecureWatch product page to learn if it’s the right fit for you and request a custom demo.
Sources:
1WWF Gaia Amazonas. “The Amazon Biome in the Face of Mercury Contamination” (2020): < https://www.gaiaamazonas.org/recursos/publicaciones/libro/102/>. Accessed 07/23/2020.
2Swenson, Jennifer et al. "Gold Mining in the Peruvian Amazon: Global Prices, Deforestation, and Mercury Imports" PloS ONE (2011): e018875. Web.
3UN Environment Programme. “Global Mercury Assessment” (2019) < https://www.unenvironment.org/resources/publication/global-mercury-assessment-2018>. Accessed 07/23/2020.