Maxar recently introduced our High-definition (HD) technology, a proprietary technique developed and owned by Maxar that improves the visual clarity of an image. To the human eye, HD offers a clear visual improvement: edges of buildings are more precise, road markings are more detailed and smaller features like traffic lights emerge. Overall, satellite images processed with HD technology are simply clearer and sharper.
While the visual benefits of HD technology are clear, how do they translate to measurable impacts on our customers’ end uses, such as identifying features, improving maps and monitoring assets? Today, a lot of those use cases are powered by machine learning (ML) algorithms. So, we wanted to know: compared to 50 cm native resolution imagery, can 30 cm HD imagery objectively improve the outcomes for customers extracting features from our imagery using ML?
Maxar’s Analytics Engineering team investigated this question by testing one type of feature detection and the results were evident. We concluded that applying HD processing to 50 cm Maxar imagery enabled us to more accurately detect and locate features of interest with greater consistency across variable lighting and real-world conditions. We will be analyzing our upcoming 15 cm HD imagery product next.
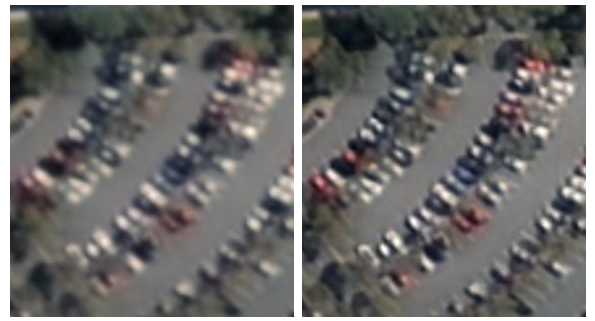
Example of vehicles parked in a crowded parking lot: on the left, imagery captured at 50 cm resolution by Maxar’s WorldView-2 satellite; on the right, the same image, processed with HD technology to create a 30 cm HD image.
Preparing and running the model
For our test we focused on passenger vehicles, which are observable in our native resolution 50 cm imagery, but not always easy to distinguish, especially in crowded areas and difficult lighting conditions (Image 1). For our area of interest, we picked Canberra, Australia because it is a compact metropolitan area that covers a variety of built environments (urban, suburban and rural). Together, these choices gave us a focused, illustrative use case to explore the effects on HD on ML.
For the experiment, we selected about a dozen of images from our WorldView-2 and GeoEye-1 satellites to cover the Canberra area and prepared two versions of each: one at 30 cm HD and one at native 50 cm resolution. Aside from the HD processing, these image pairs were identical.
Next, we developed two new object detection models–one for 50 cm imagery and one for 30 cm HD imagery. Object detection is an ML task that is used to locate specific features within an image. An object detector will generate rectangular bounding boxes around each feature it finds in the image.
To teach our ML models to recognize vehicles, we created training data by manually drawing boxes around vehicles in our HD images. We then transferred those boxes to the accompanying native resolution images, resulting in a training dataset for each image type. We fed the corresponding training dataset into its respective model training framework, resulting in two separate models. We evaluated both models against a separate sample of the labeled data that we had withheld from model training to use as ground truth.
Evaluating the model
With results in hand, we visually reviewed the outputs from each model. Under all conditions, the HD model outperformed the native resolution model. These results suggest that for our test case, HD imagery offered a clear advantage for not only detecting vehicles, but also accurately delineating their locations and extents. Some examples below.
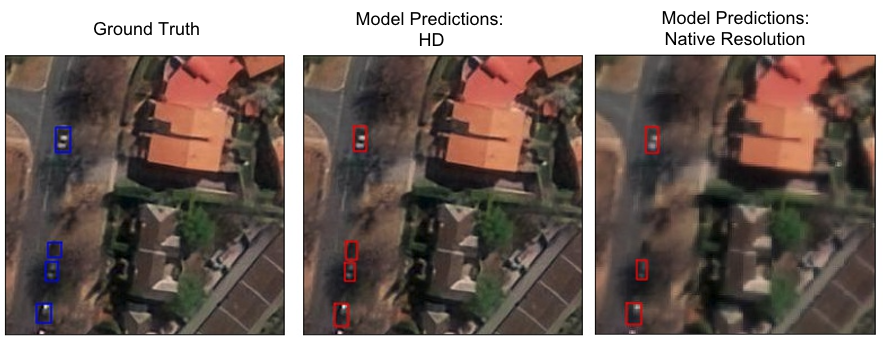
Results showing the native resolution model (right) loses a car due to shadows from nearby trees while the HD model (center) found the car.

This crowded scene challenged both our HD model (center) and the native resolution model (right), but the HD model was able to delineate cars more effectively and avoid false positives better than the native resolution model.

In this image, the HD model (center) was able to accurate identify two of three large construction trucks, while the native resolution model (right) only found the cab of one truck while also incorrectly detecting part of a structure as a vehicle.

This scene includes multiple challenging elements, including large vehicles, tightly parked vehicles and vehicles in shadows. Under all three conditions, the HD model (center) outperformed the native resolution model (right).
To conclusively quantify the measurable impact of HD on ML applications, we used our ground truth data to calculate a metric known as average precision (AP), a single score that measures an object detector’s ability to find features while avoiding false positives. AP is measured from 0 (worst) to 1 (best). When calculating AP, correct detections are identified based on whether the percent overlap (i.e., the intersection-over-union or IOU) between a detection and ground truth object exceeds a given value. At smaller IOU thresholds (e.g., 25%), AP tells you how well a detector finds features, whereas at higher IOU thresholds (e.g., 75%), AP tells you how successful the detector is at identifying the precise location and extent of objects.
Our analysis showed that our HD model outperformed the native resolution model at a range of IOU thresholds from 25% to 75%. Interestingly, the difference in performances increased at higher IOU thresholds. At an IOU of 25%, HD offered a boost of about 7% (AP of 0.80 versus 0.75 for native resolution). Meanwhile, at an IOU of 75%, the HD boost increased to 60%(!) (AP of 0.35 versus 0.22). These results suggest that for our test case, HD imagery offered a clear advantage for not only detecting vehicles, but also accurately delineating their locations and extents.
Conclusion
This initial exploration provides a great indicator of the benefits of HD for ML applications. We expect HD will unlock more meaningful data and insights for our customers too, whether they are monitoring assets, mapping the world or deriving insights and data to fuel their products.
Try out HD and let us know what you find! Download a 50 cm image sample and its corresponding 30 cm HD image sample.