Updated: Please note that EarthWatch and SecureWatch have unified under the name SecureWatch, becoming Maxar’s premiere source for Earth intelligence access. Learn more about it here.
The team of expert meteorologists at Maxar's WeatherDesk noticed unusually high temperatures being reported by the Automated Surface Observing System (ASOS) at Baltimore-Washington International Airport (BWI) this summer. While this summer has been hotter than normal, the reports from BWI suggest a mysteriously high temperature relative to the neighboring locations.
Unraveling a Mystery
In a typical summer, the ASOS sensor at Reagan National Airport (DCA) in Washington D.C. typically reports higher daily maximum temperatures than BWI. However, this year has been markedly different, with the maximum temperature at BWI being reported higher than DCA 42.2% of the time. During the same dates last year, BWI only exceeded DCA’s temperature 18.3% of the time, and 8.3% of the time during the same dates in 2017.
BWI Equal or Greater Max Temperature vs. DCA (by %) | |
2016 | 24.80% |
2017 | 25.70% |
2018 | 31.20% |
2019 | 69.70% |
Percentage of summer days with BWI having a greater than or equal max temperature to DCA
While some natural variability in temperatures is to be expected year over year, these dramatic differences suggest that something else might be responsible for the detected discontinuity. While a simple instrument error could have been the cause, we decided to examine the issue more closely, and with the help of Maxar’s EarthWatch subscription product, we might have found the culprit.
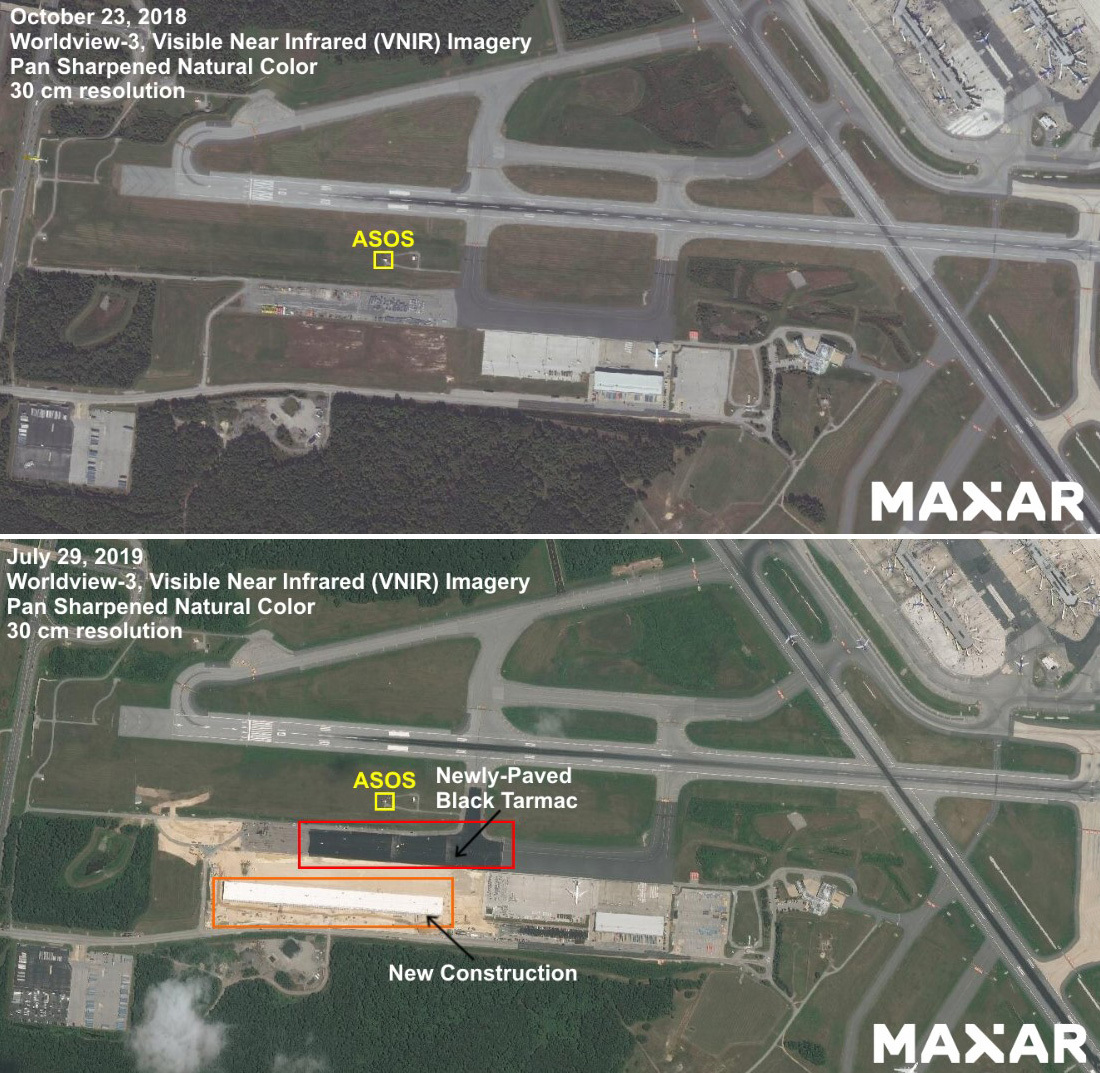
As seen in the above images from October 2018 and July 2019, the tarmac to the south and southeast of the sensor was repaved and a large building was constructed to the south-southwest of it. Fresh, black asphalt absorbs solar energy more efficiently than older, grey asphalt or non-paved surfaces, and emits the thermal energy as heat, warming the surrounding air. This process, known as the “urban heat island effect,” led to warmer temperature readings. Additionally, the new building construction likely altered the airflow, perhaps leading to air that is more stagnant especially when winds come from the south.
But Why Does it Matter?
In the energy industry, our clients use temperatures to estimate energy demand, and on a hot summer day every degree can result a significant increase in that projection. On a broader scale, warm biases such as this could result in inaccurate data for weather modeling and even for climate change studies.
At Maxar, we gather content from many sources, sensors and providers and combine it with our powerful geospatial analytics system to deliver insights and answers that help customers be more predictive in their critical decisions and more productive in their daily operations. Highlighting relevant land cover changes represents just one of many ways that we are bringing our products and capabilities together for a better world.
Looking for timely and accurate weather data to empower your decision-making? 24/7/365 consultation is available for clients worldwide. For more information, visit weather.radiantsolutions.com.