A wide variety of machine learning datasets have powered public data-science challenges over the past few years. Most recently, three challenges have released datasets to advance deep learning research leveraging powerful and abundant satellite data: SpaceNet, Functional Map of the World and xView.
Each challenge is designed to solve a slightly different problem supporting specific national security and humanitarian missions. But what they have in common is the commitment to increasing analysts’ efficiency by teaching computers to sift through massive amounts of data and extract insights faster. SpaceNet automates the extraction of building footprints and roads from satellite images enabling scaled map production and updating. Functional Map of the World (FMoW) automates the accurate labeling of features in satellite imagery, enabling dynamic feature enrichment. And now, the just-launched xView challenge will detect patterns of human activity in satellite imagery for use in national security applications and response to disasters.
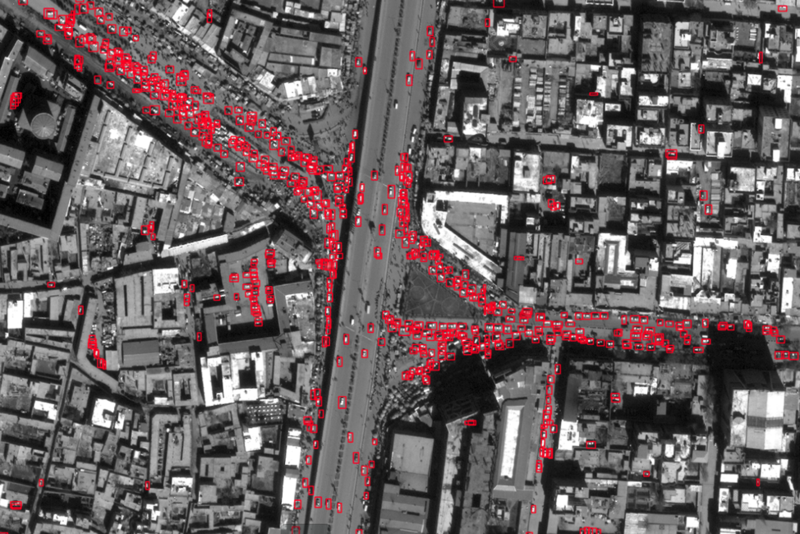
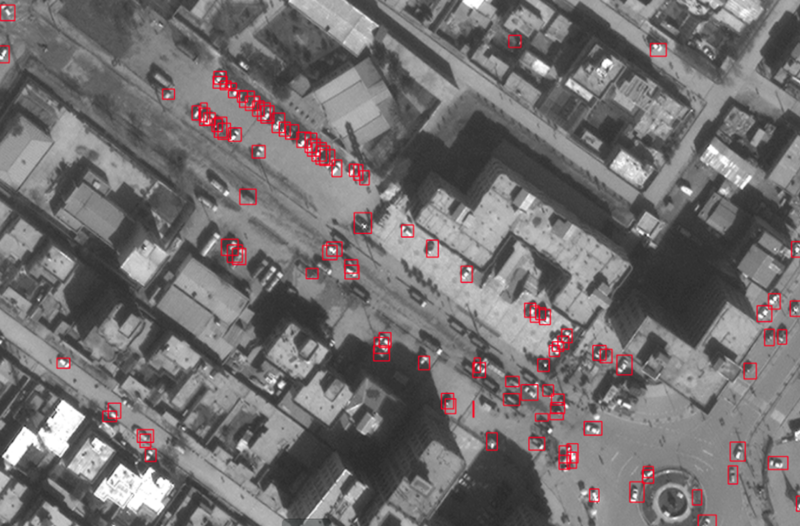
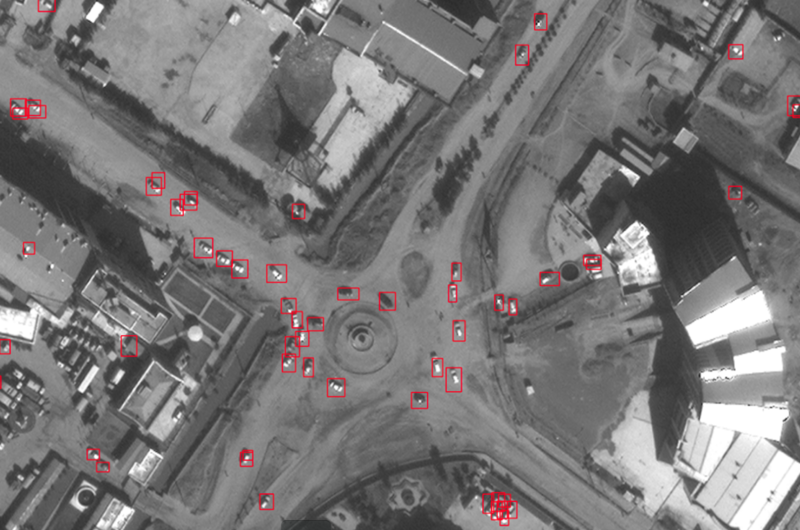
Maxar, is excited to present some of our recent results applying the xView dataset to automatically identify fixed and moving objects in satellite imagery for pattern of life discovery. This process is meant to support analysts studying specific geographic regions for patterns of life during trending events. We trained a machine learning model using the labeled imagery from xView and deployed it using DeepCore to identify individual cars in Kabul, Afghanistan over a period of time. These detections saved analysts valuable time and provided a 10,000-foot view of activity in the region never before possible in an automated fashion. In this post, we detail xView, our machine learning process, and how the results support analysts.
What is xView?
The Defense Innovation Unit Experimental (DIUx) and the National Geospatial-Intelligence Agency (NGA) have released satellite imagery and labeled training dataset for automating object detection using machine learning methods. A white paper detailing the xView dataset was published on February 22, 2018 and the public xView Detection Challenge is open for registration and is set to launch this month.
The xView dataset fills a very large void in the availability of labeled overhead satellite imagery for academic, commercial and research organizations developing and training machine learning algorithms. There are only a handful of public datasets currently available, all of which focus on a narrow range of object types. The xView dataset has more than 1 million hand-labeled objects from 60 object categories, and is geographically diverse, covering 1,400 square km of imagery from all over the world. The xView dataset is expected to fuel a wide range of future research into object-detection techniques, as well as helping to develop efficiencies and improvements in current techniques and methodologies.
What is Pattern of Life (PoL)?
Pattern of Life (PoL) analysis systematically evaluates all forms of activity, spatial and temporal, to create a comprehensive assessment of actions and behavior that would otherwise go unidentified by conventional intelligence techniques. A PoL analyst focuses on nonstandard techniques to identify activities of interest, using conventional techniques to augment the data’s value and establish its accuracy. Open Source data is the principal foundation that facilitates most PoL analysis, with a focus on social media, image and video sharing, and news media. These data sources enable a skilled PoL analyst to ascertain gaps in activity that can be exploited to establish an unknown level of awareness of a variety of activities. Most activities have a “pattern of life.” For example, an iceberg breaking off of from the parent glacier, drifting miles across the ocean and eventually dissipating to water, is a pattern of life activity. Showing vehicle traffic over time at a given location is another eligible activity. While manual analysis is an indispensable mainstay of a PoL analyst’s work, the use of machine learning, automated object detection and computer vision techniques exponentially increase the analyst’s efficiency by identifying and concentrating the analytical focus. This is our sweet spot at Maxar because of the tools we have built combined with our GBDX Big Data Platform which provides vast amounts of data from their powerful satellite constellation.
What is DeepCore?
DeepCore is a software library that simplifies complex machine learning tasks, specifically in geospatial imagery-based processes. It takes the complex nature of applying machine learning frameworks, like Caffe or TensorFlow, and wraps them in a set of consistent interfaces to be applied on satellite-based images. DeepCore’s powerful processing pipeline is fine-tuned for consuming large, complex images types typically sized at hundreds of gigabytes per image.

One of our tools built using DeepCore called OpenSpaceNet can easily process images over a large area. With an aptly named DeepCore-PixelSmasher machine built with Nvidia Quadro P6000 GPUs, we have processed a 150 GB (5,400 sq km, 50 gigapixel) image in a blazing 25 minutes. We routinely run images that are bigger than 50 GB within minutes. Be sure to pick up your jaw off the floor after watching OpenSpaceNet churn through a 50 GB tiff in 11 minutes on a laptop in this video.
Test Image
Size: 51,593 x 364,241
Bands: 3
File Size: 56,382,686,119 (≈53 GiB)
Resolution: ≈32 cm
Area: ≈4,973 km2
Computer
CPU: AMD Ryzen 1800X
(8 cores, 16 threads, 3.8 Ghz max)
RAM: 32 GiB
GPU: GeForce GTX 1080
(overclocked)
Model: DetectNet, 512x512 pixels
Window Overlap: 20% (102 pixels)
Total Processing Time: ≈11 min
What we were able to do with xView
We used xView to train a variety of neural network models to detect objects in satellite imagery. These include object classes critical for tracking patterns of life, like damaged buildings, construction equipment and tents/tarps. We prepared these models to run at scale using the DeepCore framework, and several of them are available on the GBDX platform.

We also used the xView dataset to refine our own deep learning methods. xView has more than 300,000 car instances marked, making it a great resource for developing models to detect cars. Our work on YOLOD used xView to test out modifications to the structure of neural networks that improve performance with tightly-packed cars.
Once we have confidence that our model will produce reasonable results, thanks to the help of valuable training sets like xView and novel methods like YOLOD, we can set up the model to run on any area of interest (AOI) against every good quality image of the AOI that’s been collected or will be collected and stored in the Maxar catalog. Each image is a snapshot in time of what’s happening on Earth in that AOI within the footprint of an image. Each car-count model run extracts a layer of new information from that snapshot that helps illuminate general activity and potential hot spots.
We can aggregate model outputs over time and use aggregate counts as a basis for deriving statistics that help extract and reveal new insights. In terms of PoL, however, the time of the image—and the associated day of the month, day of week, and time of day—has a profound impact on what we can expect to see at various places within the image. While we can’t reasonably expect to capture every time of day persistently with fine granularity, over time we can collect and aggregate enough of those snapshots to build up a general picture of what’s normal for an AOI.


Understanding what’s normal within an AOI is the key to revealing anomalies. Maybe you see cars where you don’t expect to see them, or you see no cars at a certain place when you do expect to see them, or maybe there’s an unanticipated buildup of cars in a parking lot that provides a clue to something bigger unfolding. This level of understanding is now possible. And when you combine extracted information from imagery with information from other sources (e.g., social media, news, etc.), you have powerful knowledge about Earth and the activities and patterns of the people and groups who inhabit it, which can be tapped to answer myriad questions across markets.
Through the combination of highly optimized software from DeepCore, millions of labeled training image chips included in the xView dataset, and a platform with a truckload of data in it, the Maxar team has an almost fully automated processing chain, which provides valuable insights in a fraction of the time an analyst could. We successfully demonstrate that our processing pipeline enables processing of 1 sq km in 0.25 seconds, while a fully trained imagery analyst takes around 25 minutes to mark all the cars in same area in the Kabul example. This shows extreme efficiency and accuracy unrivaled between man and machine. Future blog posts will demonstrate our ability to perform validation and verification (V&V) on the results of the models we build from xView and other datasets using the Tomnod platform. We will also demonstrate how these results can help predetermine where new mapping campaigns can be launched in NOME or OpenStreetMap.