Today’s users of geospatial information expect more than a map. They expect insight that allows them to better understand a place and a situation on the ground to enable informed decisions. As the use of geo-data applications expands, web-based mapping technologies offer a means for a larger audience of users to easily access and understand geospatial intelligence.
DigitalGlobe’s Insight team has a proven track record of delivering innovative geospatial solutions that help our customers serve their mission critical needs. We are now utilizing web mapping platforms, such as MapBox, to enhance our ability to deliver these solutions by creating customized sites - making our analytics products more accessible, interactive and informative.
To build an interactive web map, we start with our own imagery and analytics. We utilize open source tools like TileMill to stylize this content and JavaScript libraries based on Leaflet that allow us to create a rasterized tile stack enabling fast, compelling web maps. This map is delivered from the MapBox tile server to a web page to drive additional interactive map elements, such as navigation buttons, which are created using the jQuery JavaScript library.
Without requiring knowledge of traditional GIS software, users can easily interact with data, toggle imagery and visualize various data layers. DigitalGlobe's Human Landscape data sets, which are map layers consisting of points, lines, and polygons that characterize the human geography of a place, are well-suited as interactive layers displayed over our imagery for added context.
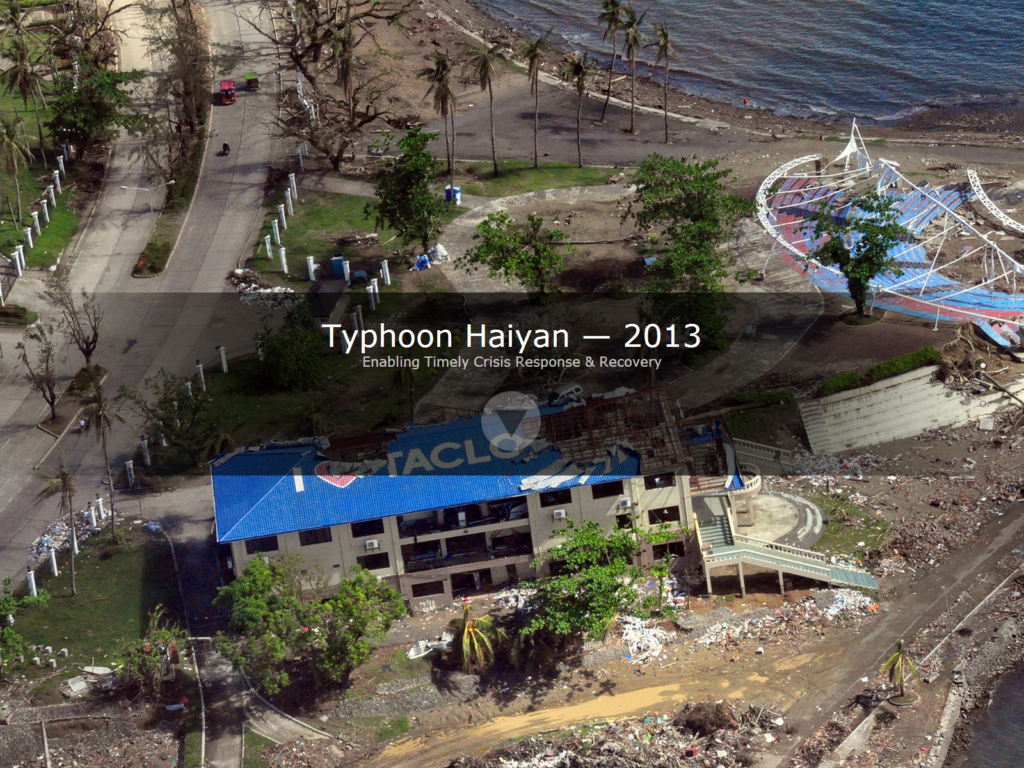
 We recently developed a site depicting DigitalGlobe’s analysis in response to Typhoon Haiyan. The site starts with an introductory series of photographs to set the stage, followed by an interactive web map that brings users from the country level into the city of Tacloban. Tacloban is one of the Philippine cities that experienced some of the most severe devastation from Typhoon Haiyan. This site tells the story of Typhoon Haiyan through DigitalGlobe imagery, crowdsourcing, and human geography layers. Such analysis helps explain the situation on the ground and for similar disasters, could be used to help inform relief planning and disaster mitigation efforts. In this example, the value of DigitalGlobe information layers is demonstrated in identifying suitable roads for routing relief supplies in a disaster zone.
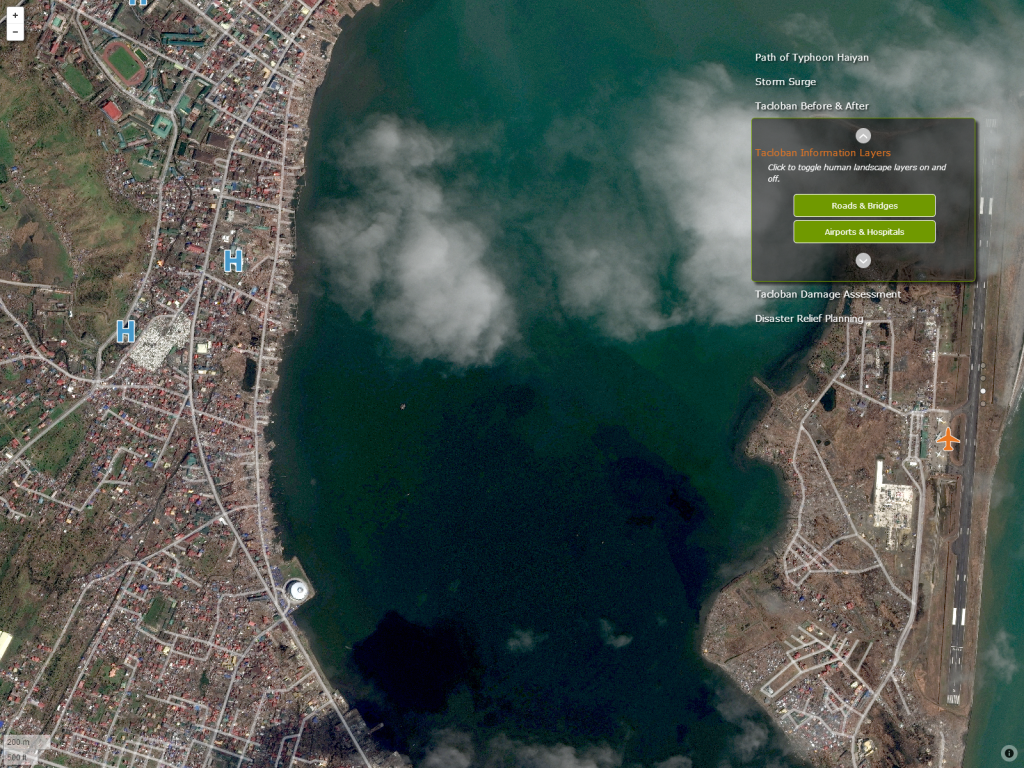
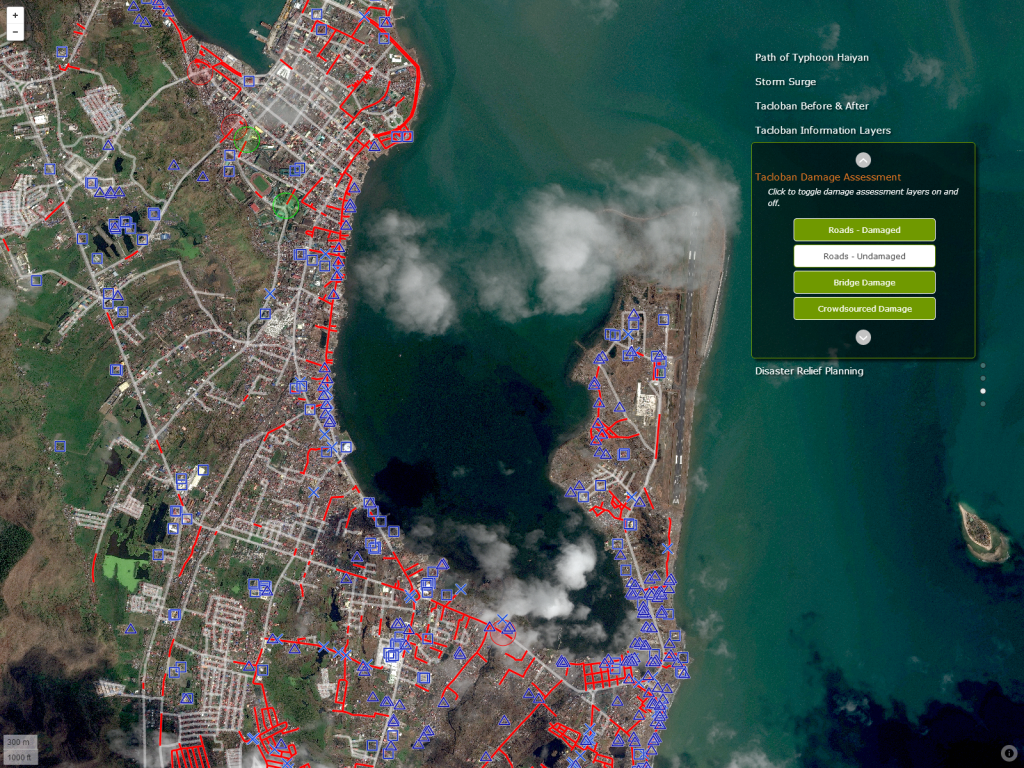
 As users zoom into Tacloban, high-resolution imagery delivered as part of our FirstLook service is displayed to contrast the city before & after the storm. Users can toggle on/off layers such as Human Landscape points of interest including hospital locations, roads, and the airport. Additionally, a road layer damage assessment is available that outlines locations of damaged bridges that were tagged by users of DigitalGlobe’s Tomnod crowdsourcing platform and show damaged infrastructure to identity suitable routes to deliver supplies.

We’re excited about the potential that web mapping technologies such as MapBox offer to enable the visualization of our analytic solutions and unique information layers. DigitalGlobe plans to develop more examples in the coming weeks and we look forward to sharing them with you via our blog.
 We recently developed a site depicting DigitalGlobe’s analysis in response to Typhoon Haiyan. The site starts with an introductory series of photographs to set the stage, followed by an interactive web map that brings users from the country level into the city of Tacloban. Tacloban is one of the Philippine cities that experienced some of the most severe devastation from Typhoon Haiyan. This site tells the story of Typhoon Haiyan through DigitalGlobe imagery, crowdsourcing, and human geography layers. Such analysis helps explain the situation on the ground and for similar disasters, could be used to help inform relief planning and disaster mitigation efforts. In this example, the value of DigitalGlobe information layers is demonstrated in identifying suitable roads for routing relief supplies in a disaster zone.
 As users zoom into Tacloban, high-resolution imagery delivered as part of our FirstLook service is displayed to contrast the city before & after the storm. Users can toggle on/off layers such as Human Landscape points of interest including hospital locations, roads, and the airport. Additionally, a road layer damage assessment is available that outlines locations of damaged bridges that were tagged by users of DigitalGlobe’s Tomnod crowdsourcing platform and show damaged infrastructure to identity suitable routes to deliver supplies.